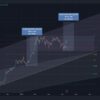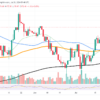
The XRP chart has recorded the bearish divergence pattern on its 60-minute chart, according to 100eyes Crypto Scanner.
The XRP chart has recorded the bearish divergence pattern on its 60-minute chart, according to 100eyes Crypto Scanner.
This pattern is based on the relationship between the price of the cryptocurrency and the Relative Strength Index (RSI) oscillator, which is used to determine whether a certain asset is oversold or not.
The bearish divergence pattern occurs when the price of a certain cryptocurrency (or any other asset) makes new highs while the oscillator makes a lower high.
Bearish divergence can indicate a downward trend in price as it usually indicates a decline in bullish momentum.
In this case, XRP recorded a lower high on the oscillator after rising earlier today.
Popular trader Mikybull recently foretold that things are about to get “interesting” for XRP as a breakout of the current RSI resistance level appears to be imminent.
XRP wins against Bitcoin
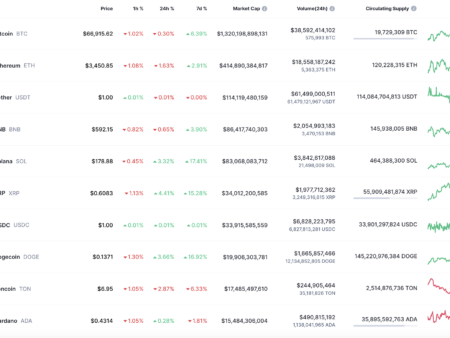
According to data from CoinGecko, XRP is currently up almost 4%, making it one of the best performing cryptocurrencies in the last 24 hours along with Solana (SOL). Earlier this Monday, the controversial cryptocurrency hit a high of $0.5671.
Meanwhile, Bitcoin is down 1.3% over the same time period. XRP has gained approximately 5% against this Bitcoin. This lack of correlation has puzzled some members of the community given that there are no new legal developments in the SEC v. Ripple.
It is worth noting that the Ripple-affiliated cryptocurrency has been in the red for nine consecutive months. It remains to be seen if it will manage to surpass the cryptocurrency king in May to finally break this disastrous streak.