XRP is currently experiencing what we sometimes call a “squeeze.” This technical phenomenon occurs when the price of an asset consolidates, leading to a battle between buyers and sellers for control of the market direction in a narrow price range.
XRP is currently experiencing what we sometimes call a “squeeze.” This technical phenomenon occurs when the price of an asset consolidates, leading to a battle between buyers and sellers for control of the market direction in a narrow price range.
XRP’s contraction is evident as the price approaches a convergence of its moving averages, which are fundamental indicators of both support and resistance. The 50-day moving average (orange line) and 100-day moving average (blue line) converge around the $0.55 to $0.58 range, creating a crucial zone that XRP must hold to maintain a bullish stance. A break below this level could indicate a bearish slowdown as these averages would act as resistance.
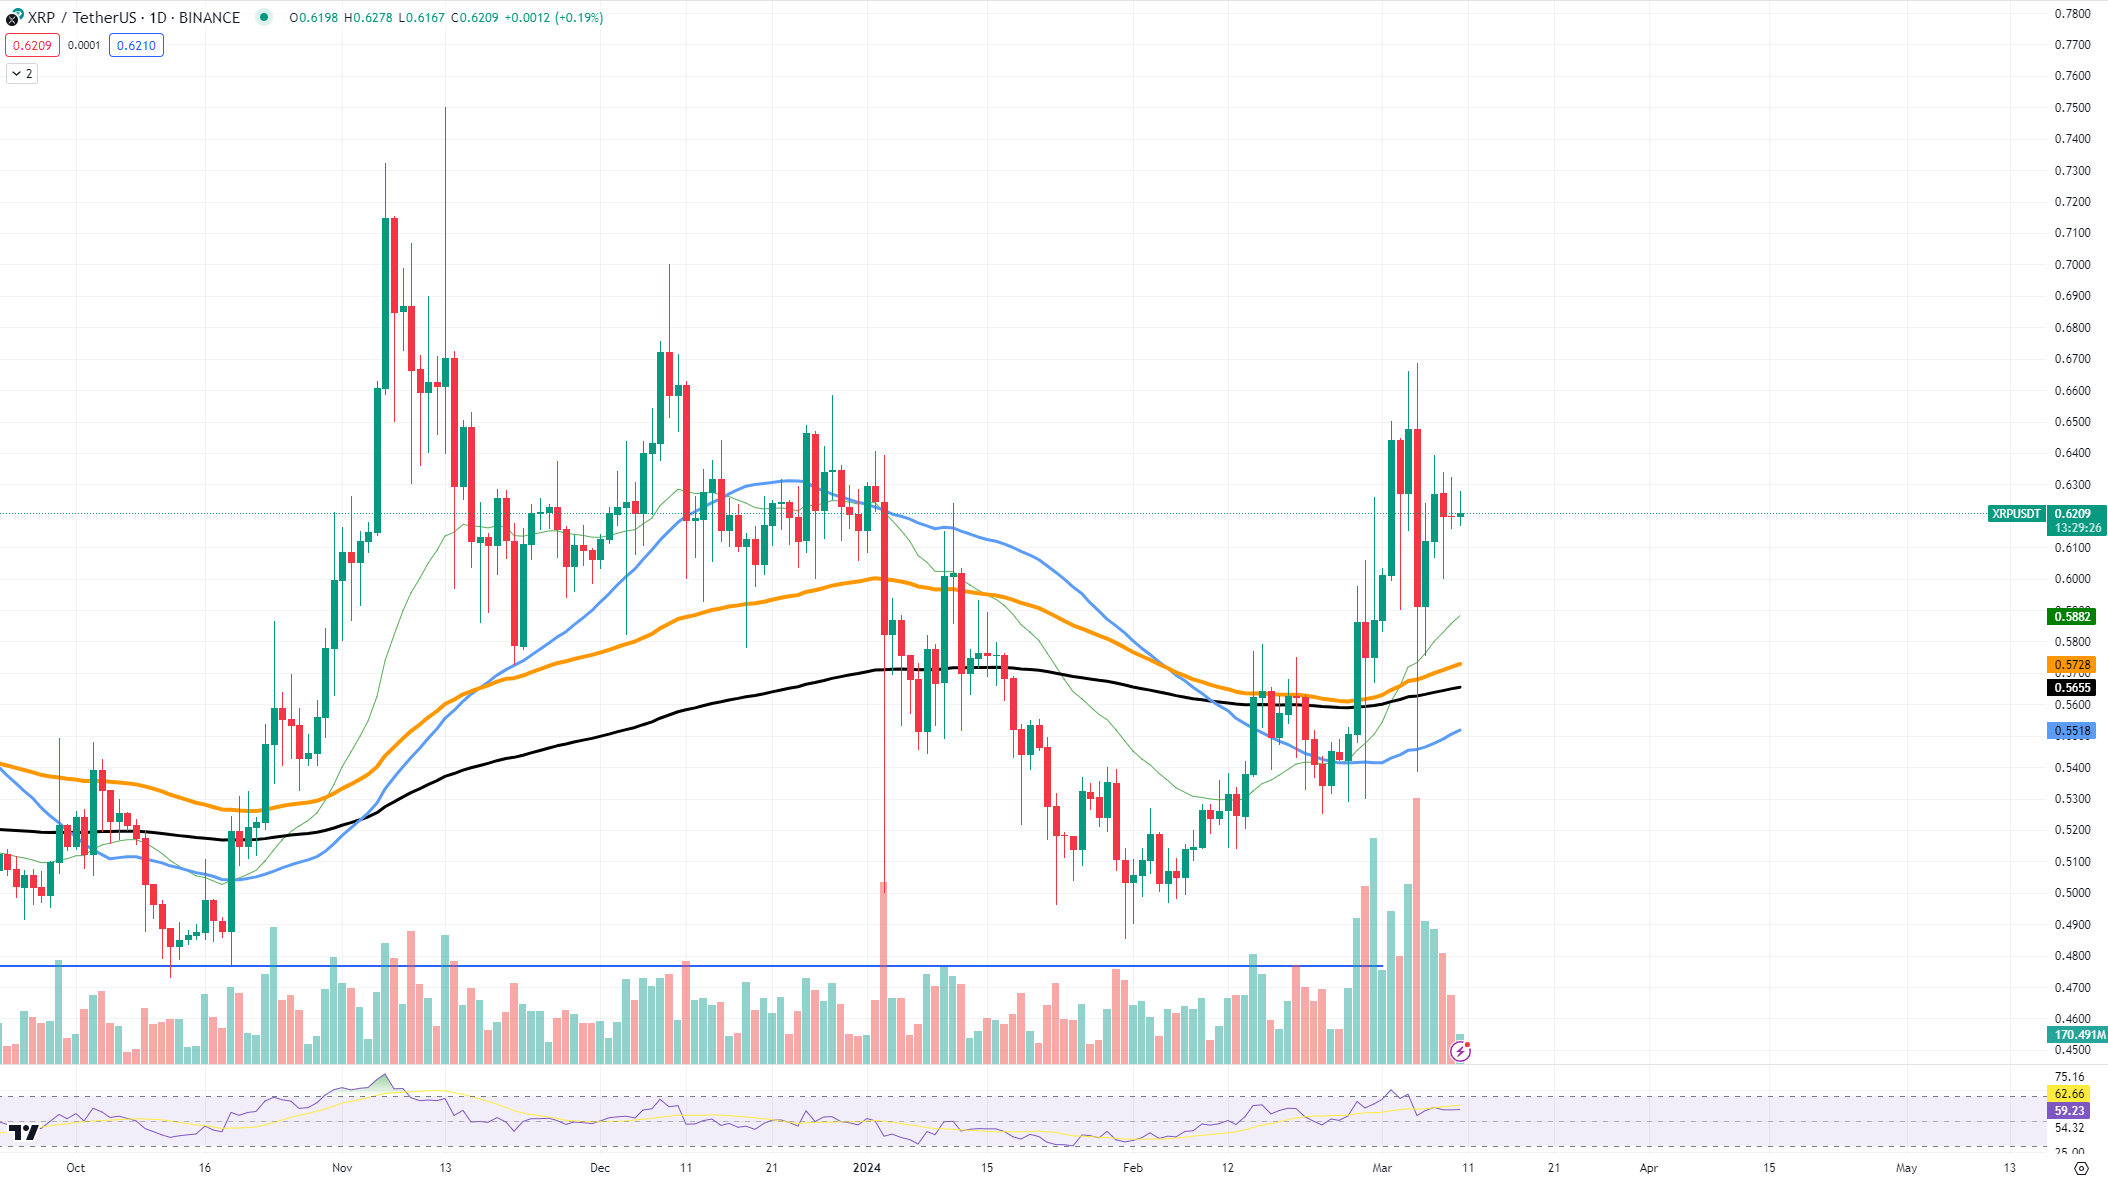
The short-term resistance level for XRP currently sits at approximately $0.63. This level has recently thwarted bullish moves and a break above could pave the way for further bullish momentum. On the contrary, if XRP price fails to stay above the moving averages, the next support level lies near $0.50, where buyers can intervene to stabilize the price.
There is a possibility of a price reversal, especially considering that the RSI (relative strength index) remains in a neutral zone, reflecting the uncertainty in the market. A decisive move in either direction, backed by substantial volume, will likely set the tone for XRP price in the coming days or weeks.
Ethereum Major Test
Ethereum is exhibiting strong bullish behavior as it approaches the fundamental price of $4,000. This threshold, seen as an important psychological and technical barrier, is within our reach, given the current momentum seen on the TradingView chart. Here, we look at the chances of a big breakout and the price action surrounding this rise.
The current price chart reveals Ethereum’s determined rise, marked by a series of higher lows and bullish candles. Immediate support for ETH is firmly established around the $3,400 level, which aligns with the 50-day moving average, a key indicator that often acts as dynamic support in an uptrend. This level has been tested and held recently, suggesting strong buying interest at these prices.
As for resistance levels, $4,000 is of great importance. It is a round number that has historically acted as a tough nut to crack. However, pressure is building as volume and price action indicate continued demand for Ethereum. Breaking above this level would likely spark a new wave of optimism and potentially trigger a rally to new highs.
A rise towards $4,000 is supported by Ethereum fundamentals such as continuous network upgrades and a vibrant decentralized finance (DeFi) ecosystem. Additionally, as Bitcoin’s dominance in the market ebbs and flows, investors often look to ETH as a bellwether of altcoins’ potential, increasing its value.
However, there is always the possibility of a price reversal. The Relative Strength Index (RSI) is currently indicating overbought conditions, which may indicate a possible pullback or consolidation before further bullish moves. Traders and investors will monitor this closely as any reversal signal could lead to short-term profit taking.
Bitcoin at $70,000
Bitcoin presents signs suggesting the need for caution despite its recent bullish behavior. Investors and technical analysts are closely watching the charts for indications of what lies ahead for the world’s leading digital currency.
As we analyze the BTC/USD pair on TradingView, we find that Bitcoin is hovering around the resistance level of around $69,000. This price has served as a rigid ceiling of late, and attempts to break it have met with stiff resistance.
The relentless approach towards this barrier indicates strong bullish sentiment in the market, but the inability to overcome it may lead to a build-up of selling pressure.
Support levels, crucial to sustain the current rally, are set around $59,586, coinciding with the 50-day moving average. Historically, this moving average has acted as reliable support in uptrends, but a break below could signal weakening momentum and the possibility of a broader price correction.