XRP is currently facing a critical crossroads. The question is whether XRP can maintain its position at the $0.5 mark or if the recent drop below multiple moving averages indicates a more substantial pullback.
XRP is currently facing a critical crossroads. The question is whether XRP can maintain its position at the $0.5 mark or if the recent drop below multiple moving averages indicates a more substantial pullback.
At a glance, the XRP chart paints a worrying picture for bulls. Recently, the asset has fallen below several key moving averages, which traditionally act as support layers. The 50-day, 100-day, and 200-day moving averages have now become resistance levels, which XRP would need to overcome to regain bullish momentum. These moving averages, particularly the 200-day, are closely followed by traders and can often dictate the direction of the trend over the medium to long term.
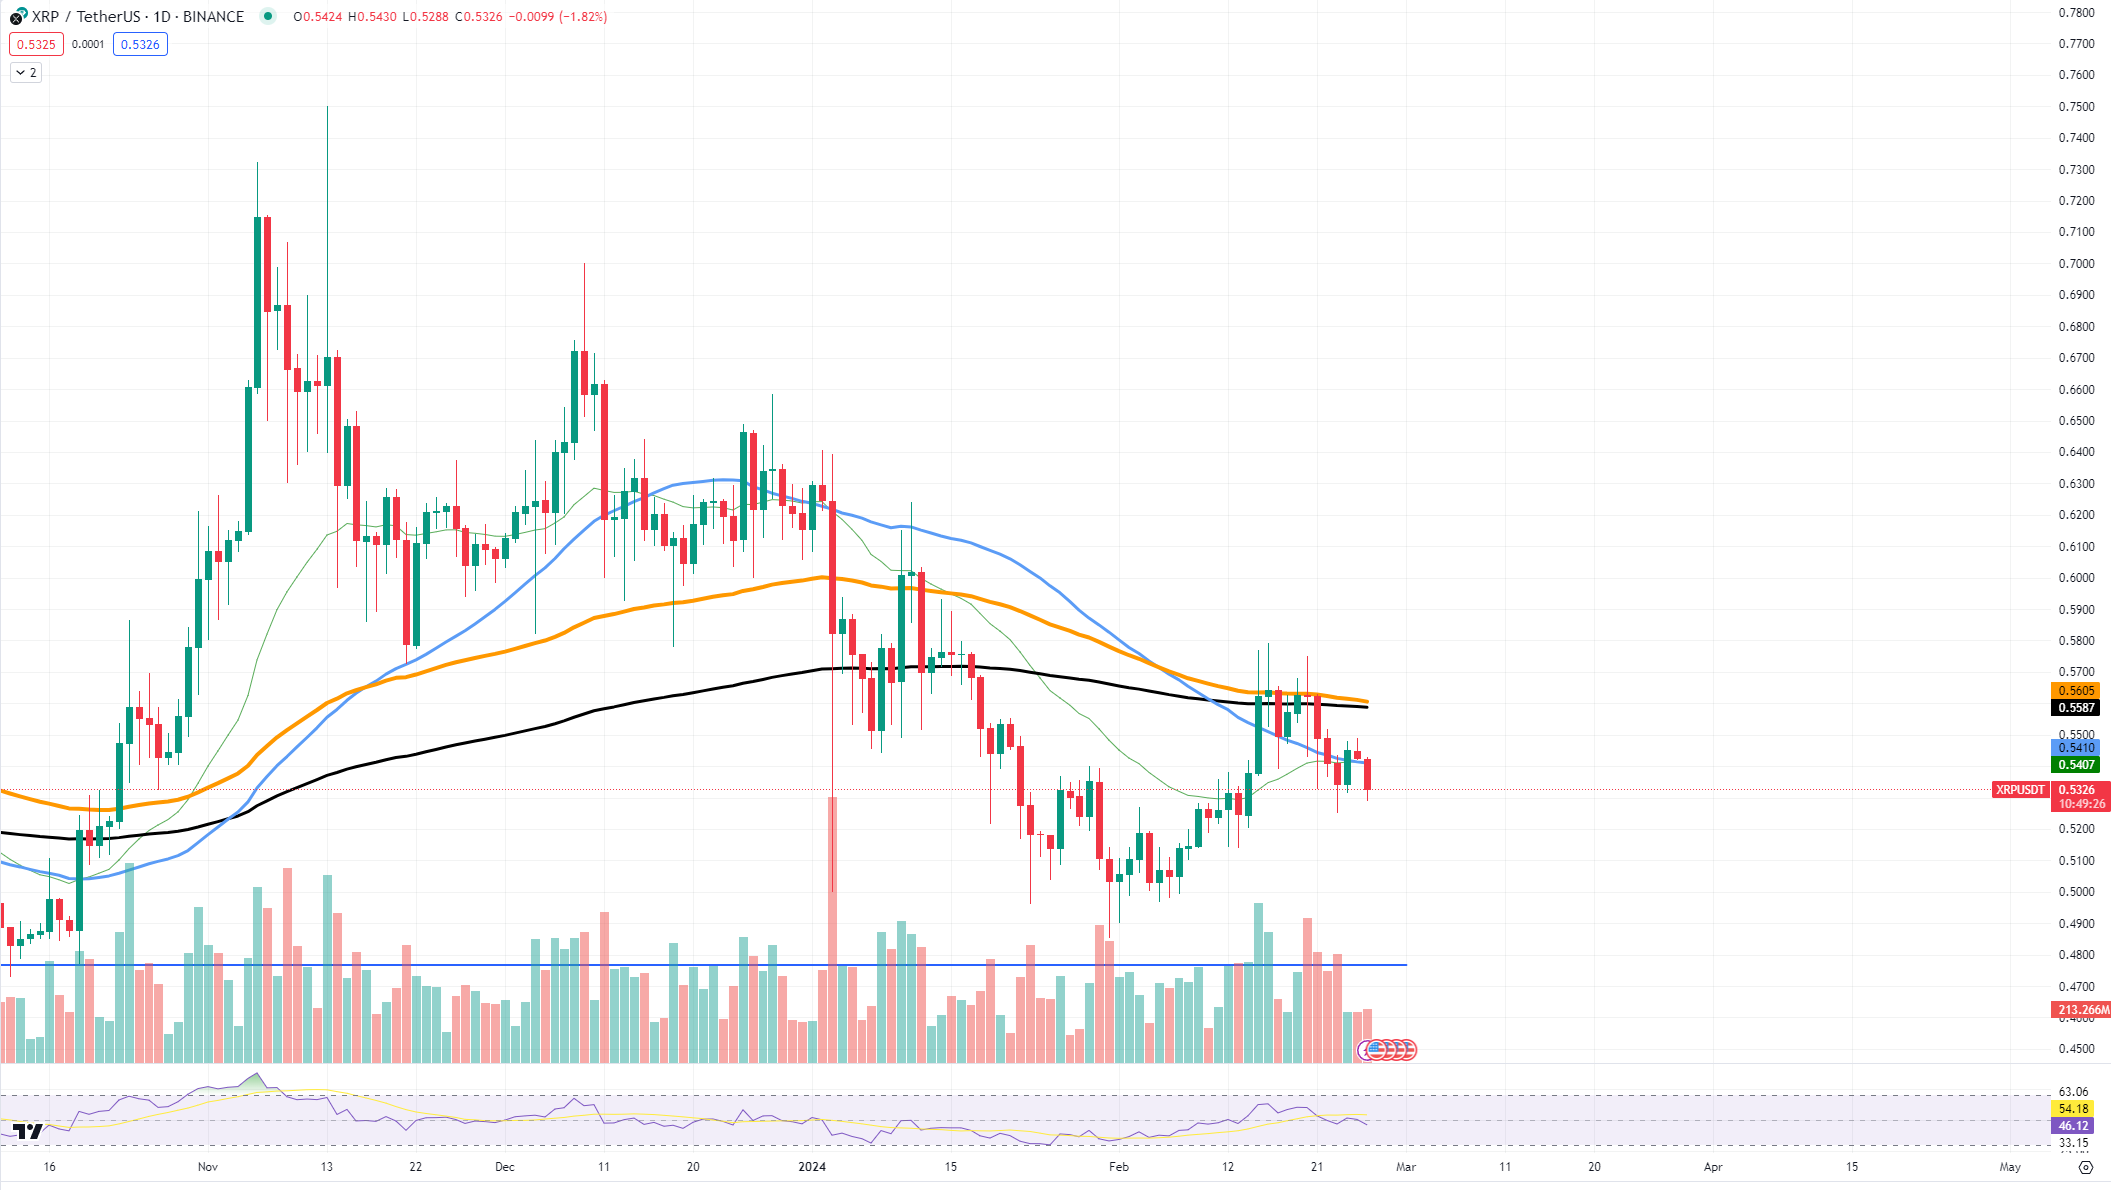
Current resistance levels sit near $0.5587 and $0.5850, which represent recent local highs and the proximity of the 50-day moving average. A successful breakout and close above these points could indicate a possible reversal of the recent downtrend. Conversely, support levels to watch are at $0.4700 and $0.4500, where buyers have historically shown interest.
If XRP can consolidate and retrace above the $0.5 threshold, it would need to maintain the upward movement and close above the aforementioned moving averages. This could instill confidence among traders, which could trigger a rally towards higher resistance levels.
Dangerous growth
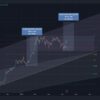
The US Dollar Index serves as a barometer of the dollar’s strength against a basket of foreign currencies and is often inversely correlated with the cryptocurrency market. Recently, technical analysts have been watching the formation of a “Golden Cross” on the DXY chart, a bullish signal where the 50-day moving average crosses above the 200-day moving average. If this pattern materializes, it could spell trouble for the cryptocurrency market, traditionally sensitive to a strengthening dollar.
The DXY chart currently shows the index hovering around the 103.87 mark, with the 50-day moving average approaching the 200-day moving average. A Golden Cross formation would typically indicate that a long-term uptrend is coming for the dollar, suggesting further buying momentum.
The link between DXY and cryptocurrencies is evident; A stronger dollar often leads to a decrease in the price of digital assets like Bitcoin and Ethereum. Investors often turn to the safety of the dollar in uncertain economic times, which can lead to a retreat from risk assets such as cryptocurrencies. If the Golden Cross on the DXY actually materializes and triggers a dollar rally, the cryptocurrency market may see a corresponding slowdown as capital flows out of digital assets and into the traditional haven of fiat currency.
Cardano is no longer bullish
Cardano has recently shown signs of a trend reversal, breaking out of its bullish mode. This shift in momentum has sparked debates among investors and traders as they reassess the asset’s near-term prospects.
After a period of sustained upward movement, ADA broke below its ascending channel, a structure that generally indicates bullish sentiment. This break down indicates a potential shift towards bearish momentum or at least a pause in the uptrend. The price is now hovering around $0.575, just below the lower boundary of the previous channel, suggesting a possible new resistance level.
As for support levels, the immediate one is at $0.5385, which is essential for ADA to sustain and avoid further declines. A break below this support could lead to a test of the next support level around $0.5112, where the 50-day moving average may offer some buoyancy to the price.
Cardano’s current trajectory points to a cooling period following its exit from the bullish channel. The volume profile shows a decline during this slowdown, which could indicate a lack of conviction among sellers. However, for ADA to regain its bullish stance, it would need to re-enter the channel and maintain momentum above the $0.60 mark, challenging the recent highs around $0.68.