Shiba Inu has suffered a dramatic 40% drop, leaving us with many questions.
Shiba Inu has suffered a dramatic 40% drop, leaving us with many questions.
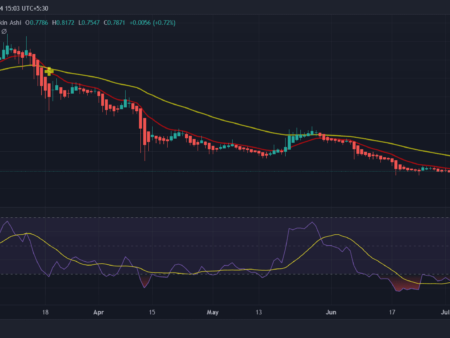
A look at the price chart indicates a sudden and sharp correction after a period of extraordinary gains, which is not uncommon given the volatile nature of SHIB. The digital asset experienced a surprising rally that propelled it to significant highs, only to be followed by a rapid decline. These moves often test support levels and in this case, SHIB found some footing after the drop.
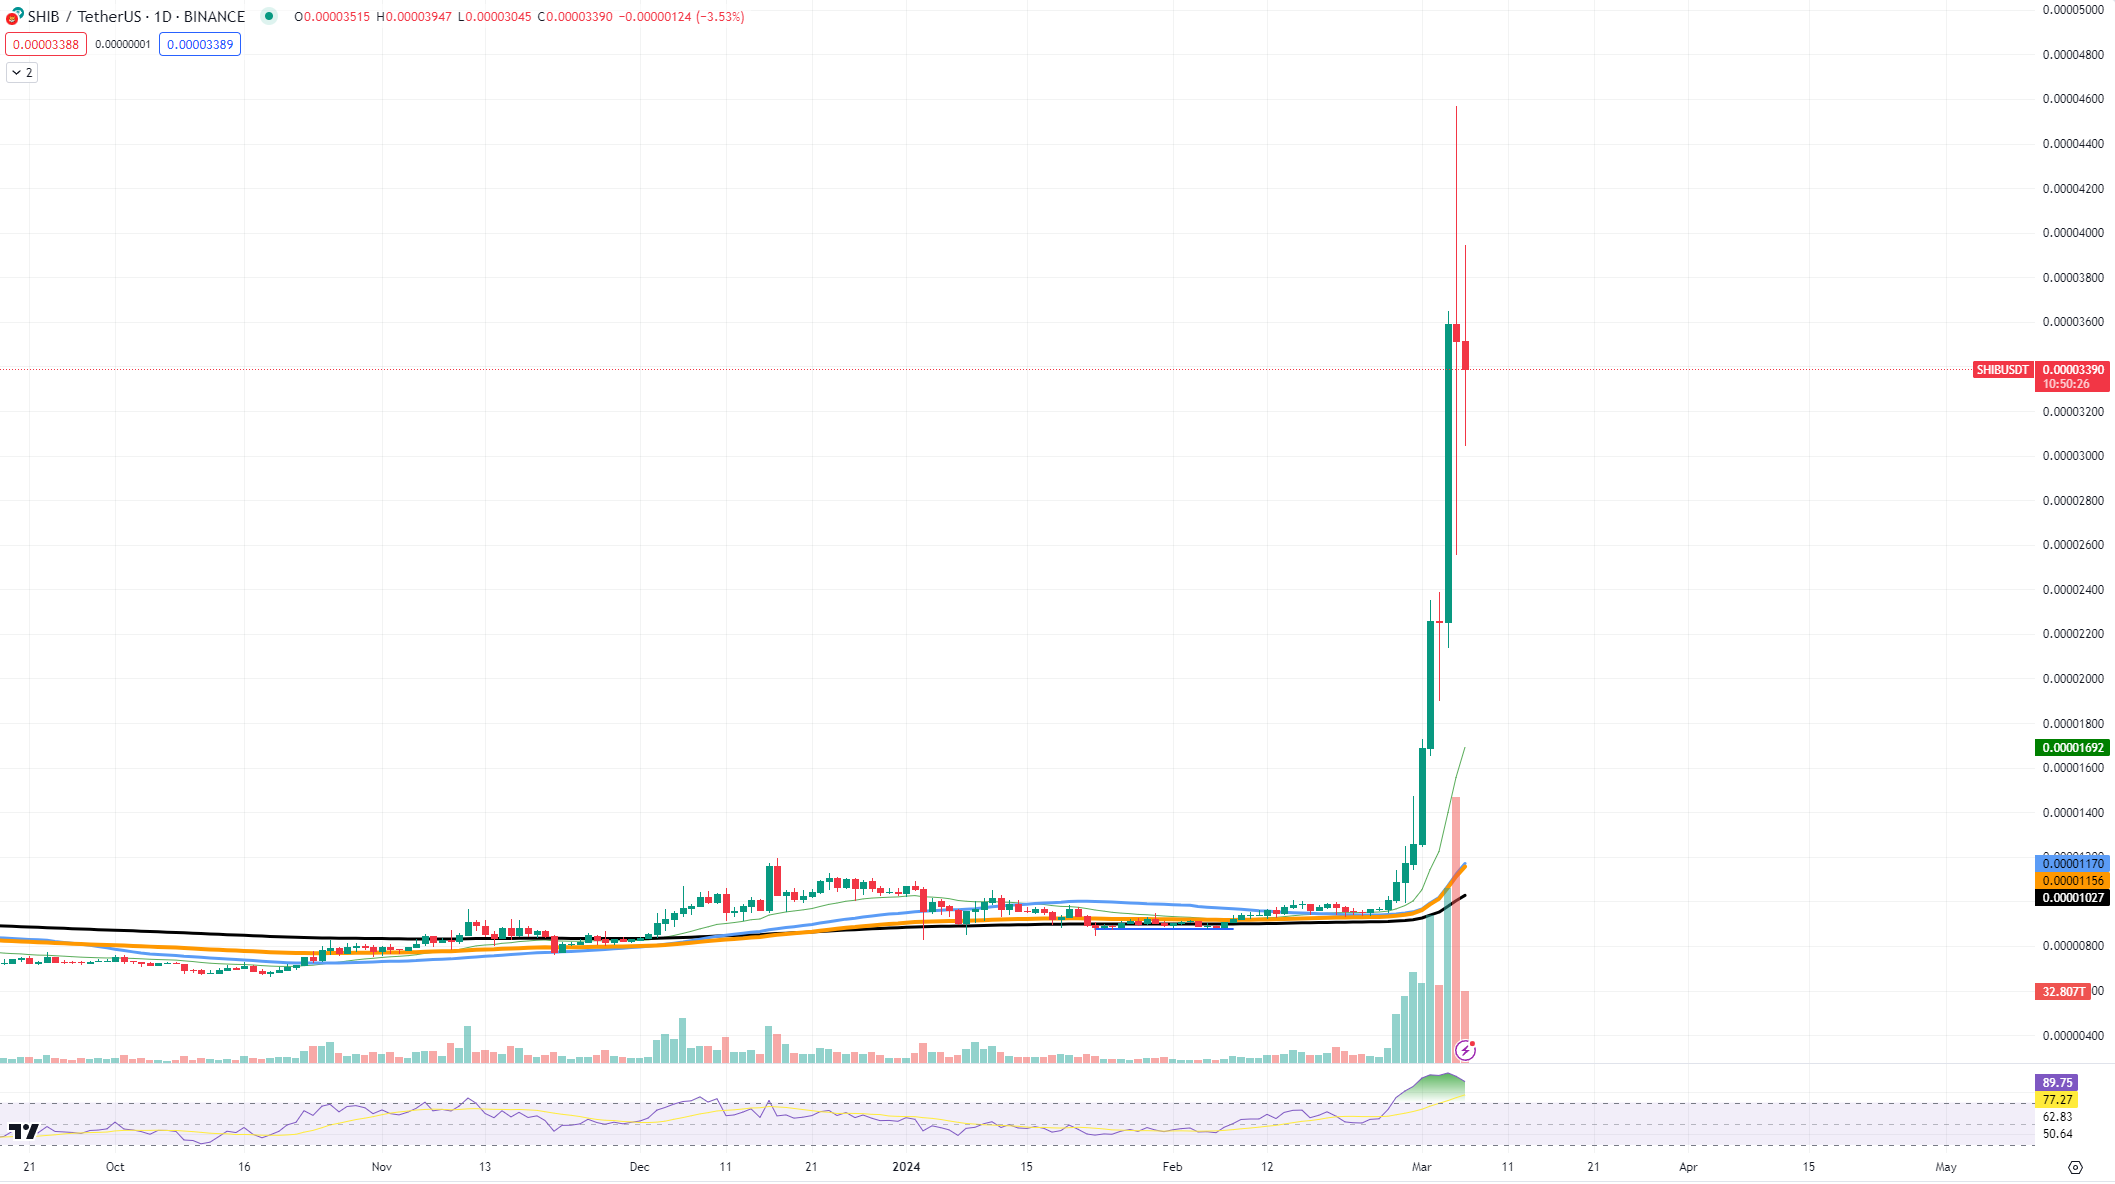
The recent decline has broken several support levels that could previously hold during the bullish momentum. However, new resistance levels have formed following the decline. If SHIB were to attempt a recovery, it would have to break through these levels to signal a possible comeback.
Market sentiment around SHIB remains cautious. The enormous holdings of the founder, known colloquially as a “whale,” may raise concerns about market manipulation and the possibility of large sell-offs that could dramatically affect the price. The concern is that if the founder decides to liquidate a portion of his holdings, it could trigger further serious corrections in the market.
From a bullish perspective, SHIB’s community-driven approach and its growing ecosystem could help the cryptocurrency recover, especially if more use cases emerge or it achieves greater adoption. However, the bearish scenario is a continuation of the correction, especially if the market starts to see movements in founders’ portfolios, which could trigger panic selling.
XRP looks bleak
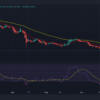
The recent price chart for XRP shows a peak that quickly gave way, leading to a rapid erasure of gains. After an optimistic rally, the market correction has been rapid and relentless. Technical analysis indicates that XRP has broken through key support levels, namely around the $0.60 mark, which previously served as a solid foothold during its ascent. Failure to maintain this critical level could indicate that bearish sentiment is taking hold among investors.
As the price of XRP declined, the next major support zone lies near the $0.55 to $0.57 range, a region where the asset has consolidated in the past. If this support does not hold, the price could fall further to test the next support level near $0.50, a psychological barrier and historically significant level of interest.
Current resistance lies at the recent peak, and reclaiming this level would be essential for XRP to regain its upward momentum. A bounce with significant volume could see XRP aim to challenge higher resistance levels.
Can Bitcoin Hit Highs Again?
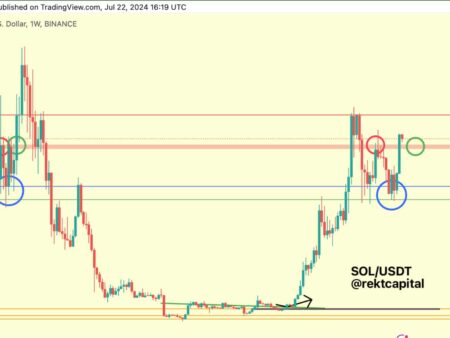
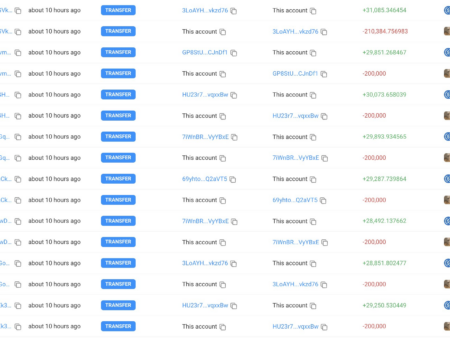
The Bitcoin market has been a whirlwind of activity as its price has reached a major new threshold. A recent sudden drop from $69,000 to $59,000 left market watchers stunned as a 14-year-old dormant whale account unloaded a substantial stake, sending ripples across the cryptocurrency landscape. This event marked a possible local high, but Bitcoin’s resistance suggests a recovery could be on the horizon.
The Bitcoin chart reveals that after the sharp drop, the coin is trying to recover, indicating strong buying interest at lower levels. A key support level at $59,000, corresponding to the whale sell-off, has proven to be solid, and the price bounced off this mark. The rapid recovery to levels above $60,000 underlines the relentless demand for Bitcoin despite the sudden market shocks.
The immediate resistance Bitcoin faces now is formed by the previous high around $69,000. Traders and investors will closely monitor this level to see if it becomes resistance or if Bitcoin can convincingly break through it.
If Bitcoin fails to maintain its recovery, it could find support at the $59,000 level once again. A break below this could trigger further sell-offs as stop-loss orders are triggered. In such a bearish scenario, Bitcoin could enter a consolidation phase or correct further, testing lower support levels around $55,000.