As in the past, meme coins were the stars of the show after the market rallied between May 3 and 4. [WIF] led the pack with a 20.58% increase in 24 hours. Dogecoin (DOGE) also rose by 13.80% while Pepe (PEPE) rose by 12.93%.
Floki (FLOKI), Bonk (BONK), and Shiba Inu (SHIB) also joined the rally as their prices outperformed most other assets in the market.
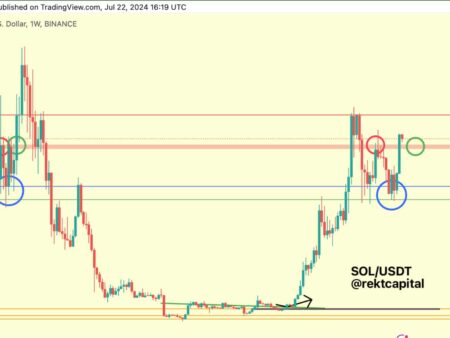
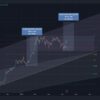
WIF vs. DOGE
The price of WIF at the time of writing was $3.32 and the 4-hour chart showed no resistance in sight. If this continues, bears may not be able to stop WIF’s bullish momentum.
The golden section of 1.618 indicated that the meme coin may target $4.36 as the next support level. Meanwhile, DOGE is also correlated with WIF. If this correlation remains unchanged, DOGE expects an increase of 19.17%. From its price at the time of writing, DOGE could rise towards $0.18 in a short period.
4 Hour WIF Analysis vs. DOGE (Source: TradingView)
However, traders may need to pay attention as the RSI showed that WIF was overbought and DOGE was near a similar point. If profit-taking begins, cryptocurrency prices could retrace. On the other hand, a bullish scenario could give them a higher value.
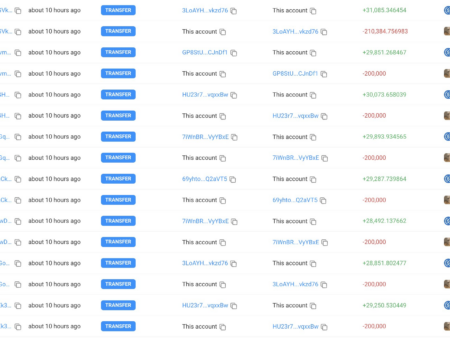
PEPE vs. FLOKI
The market structure of PEPE was similar to that of WIF and FLOKI was also not excluded. According to the 4-hour chart, the breakout experienced by PEPE and FLOKI is due to the formation of a bullish flag.
This happened due to vendor burnout. Therefore, if the price of PEPE rises, there is a high probability that FLOKI will do the same. Furthermore, if the price of PEPE fell, FLOKI could dump. Additionally, the Awesome Oscillator (AO) was positive, indicating increasing upward momentum.
PEPE vs. FLOKI 4-hour analysis (Source: TradingView)
Therefore, the price of PEPE could continue to rise as well as that of FLOKI. Additionally, On Balance Volume (OBV) increased, suggesting that buying pressure was intense to keep the price high.
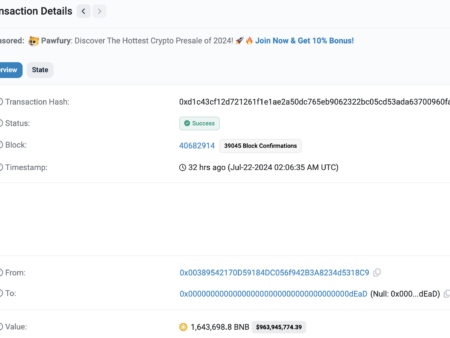
BONK vs. SHIB
Comparing the BONK and SHIB graphs revealed that there was a difference in the trend. While prices moved together at one point, at other times they decoupled. However, the Money Flow Index (MFI) on the BONK/USD 4-hour chart showed that the token was overbought.
4-hour analysis of BONK vs. SHIB (Source: TradingView)
This is because the MFI reading was 89.99. A reading above 80.00 indicates that an asset is overbought. While the reading also signals high capital flow, traders may soon start withdrawing their money, letting SHIB and BONK prices fall.
Disclaimer: The information presented in this article is for informational and educational purposes only. The article does not constitute financial advice or advice of any kind. Coin Edition is not responsible for any losses incurred as a result of using any content, products or services mentioned. Readers are advised to exercise caution before taking any action regarding the company.