XRP is targeting the next significant hurdle at $0.6. Recent trading sessions have seen a commendable performance from XRP, which has successfully breached several local resistances, positioning itself for a potential bullish trajectory.
Analyzing the price dynamics, we observe a strong spike in volume, which is indicative of strong buyer interest and could signal the start of a sustained uptrend. This is a vital factor as volume often validates the price movement, lending credence to the breakthrough and setting the stage for the subsequent rally.
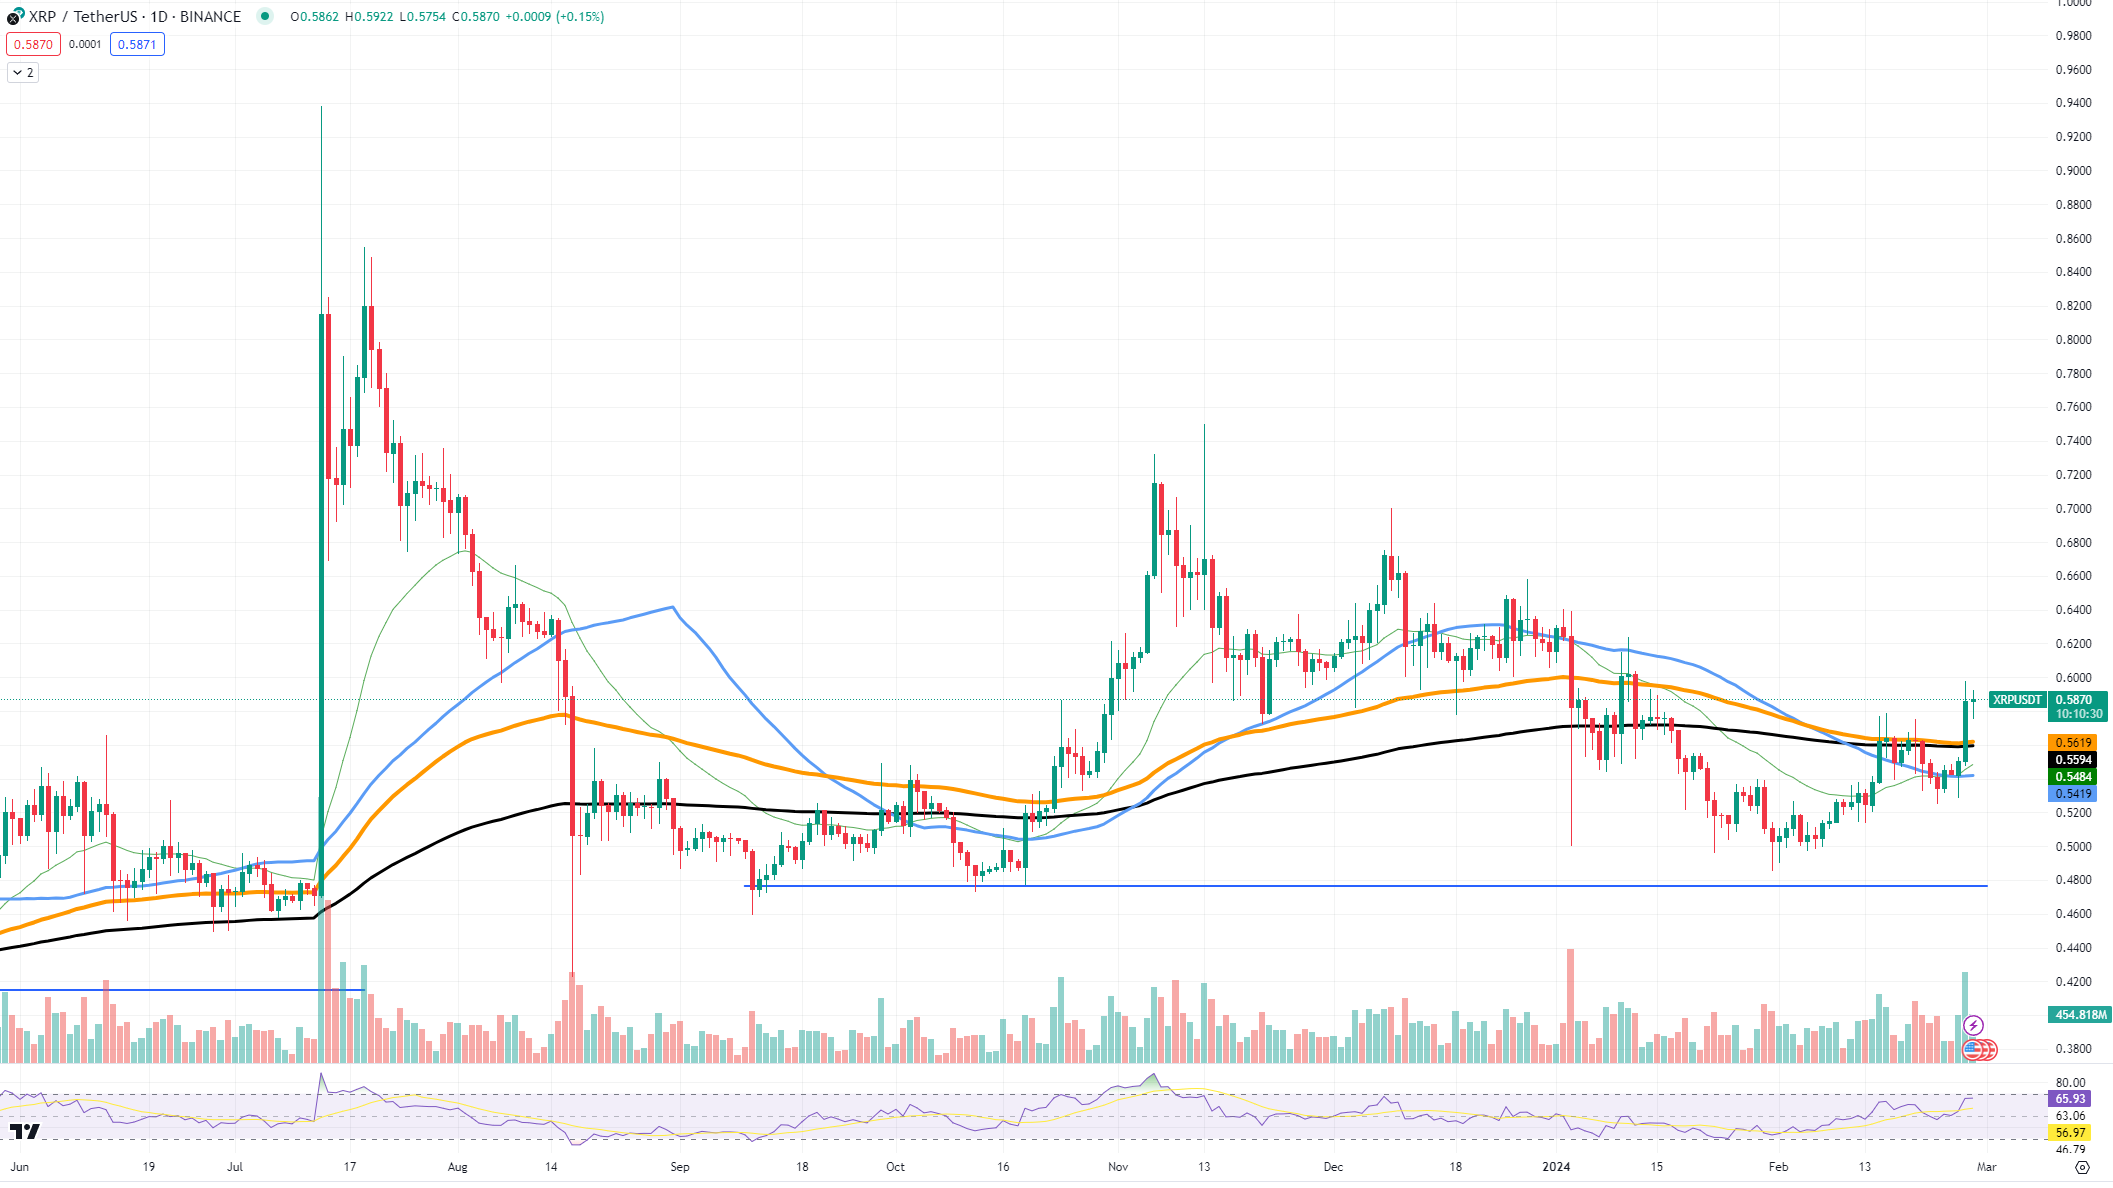
XRP’s current trend shows it moving above the crucial moving averages, a bullish indicator that suggests the asset has ample support for its rise. The intersection of these moving averages served as a springboard for the price, pushing it towards the $0.6 mark.
Looking at the resistance and support picture, the immediate resistance is actually at the $0.6 mark. A decisive close above this level could pave the way for a prolonged rally towards higher resistance zones.
Conversely, if XRP faces rejection at this level, it could pull back to test the strength of its new support levels, potentially around the $0.55 to $0.53 range, where the confluence of the moving averages could offer a buffer against a deeper pullback.
Cardano on the verge of upside
Cardano’s native token, ADA, is showing signs of a strong uptrend as it approaches a significant resistance level at $0.68. This move is particularly noteworthy as it positions ADA to potentially surpass the highest price reached in 2024. The trading community is closely monitoring ADA’s performance for a decisive break that could set new benchmarks for the year.
A detailed price analysis reveals that ADA has consistently formed higher lows, which is indicative of accumulating strength and buying pressure. The recent uptrend has been supported by increasing volumes, suggesting that bullish sentiment is supported by active market participation. The $0.68 level is critical; a convincing move above this price could trigger further buying as it would confirm a break from the recent consolidation pattern.
From a technical perspective, ADA remained above the 50-day and 200-day moving averages, which traditionally serve as dynamic support levels. The convergence of these averages provides a solid foundation for the token, making the path to the $0.68 resistance more reachable. A successful break above this threshold could open the door to testing previous yearly highs and potentially the all-time high (ATH).
Looking at the current trend, the next major resistance after $0.68 is expected to be between $0.75 and $0.80, where ADA may encounter a tougher barrier due to historical price actions. On the support side, the key levels to watch are $0.61 and $0.55, which have previously acted as both support and resistance.
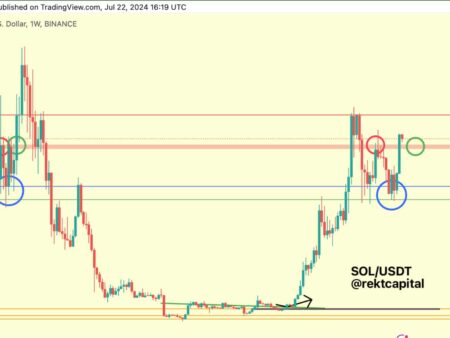
The failed battle of Solana
Solana has been a strong contender with its high-speed, low-cost transactions. However, recent market developments have seen Ethereum reclaim its dominance, overshadowing the progress of its competitors.
A comparative price analysis shows that while Ethereum has gained in both market capitalization and price, Solana has lagged behind. The SOL token is struggling to keep up, as evidenced by its performance on the price charts. After a period of consolidation, Solana is now grappling with resistance levels that once constituted strong supports, particularly around the $108 mark.
According to the latest trends, SOL is trading in a channel, with its immediate resistance near $120. The key support to watch is at $100, a psychological level that could dictate Solana’s near-term price direction. If this level were to fail, the next support would be found in the $89 zone, marked by previous price interactions.