Solana has been showing a spirited attempt to regain its previous highs after a challenging period. The asset recently approached the $140 price level and technical indicators suggest that a reversal may be on the horizon.
Solana has been showing a spirited attempt to regain its previous highs after a challenging period. The asset recently approached the $140 price level and technical indicators suggest that a reversal may be on the horizon.
Currently, Solana is testing the 100-day EMA, which closely matches the $140 level. This is a critical juncture for the cryptocurrency as the 100 EMA often acts as an important barometer for bullish or bearish trends. The increasing trading volume accompanying this price action adds a surprising twist to the narrative. Typically, an increase in volume coupled with a test of key moving averages indicates strong potential for a breakout.
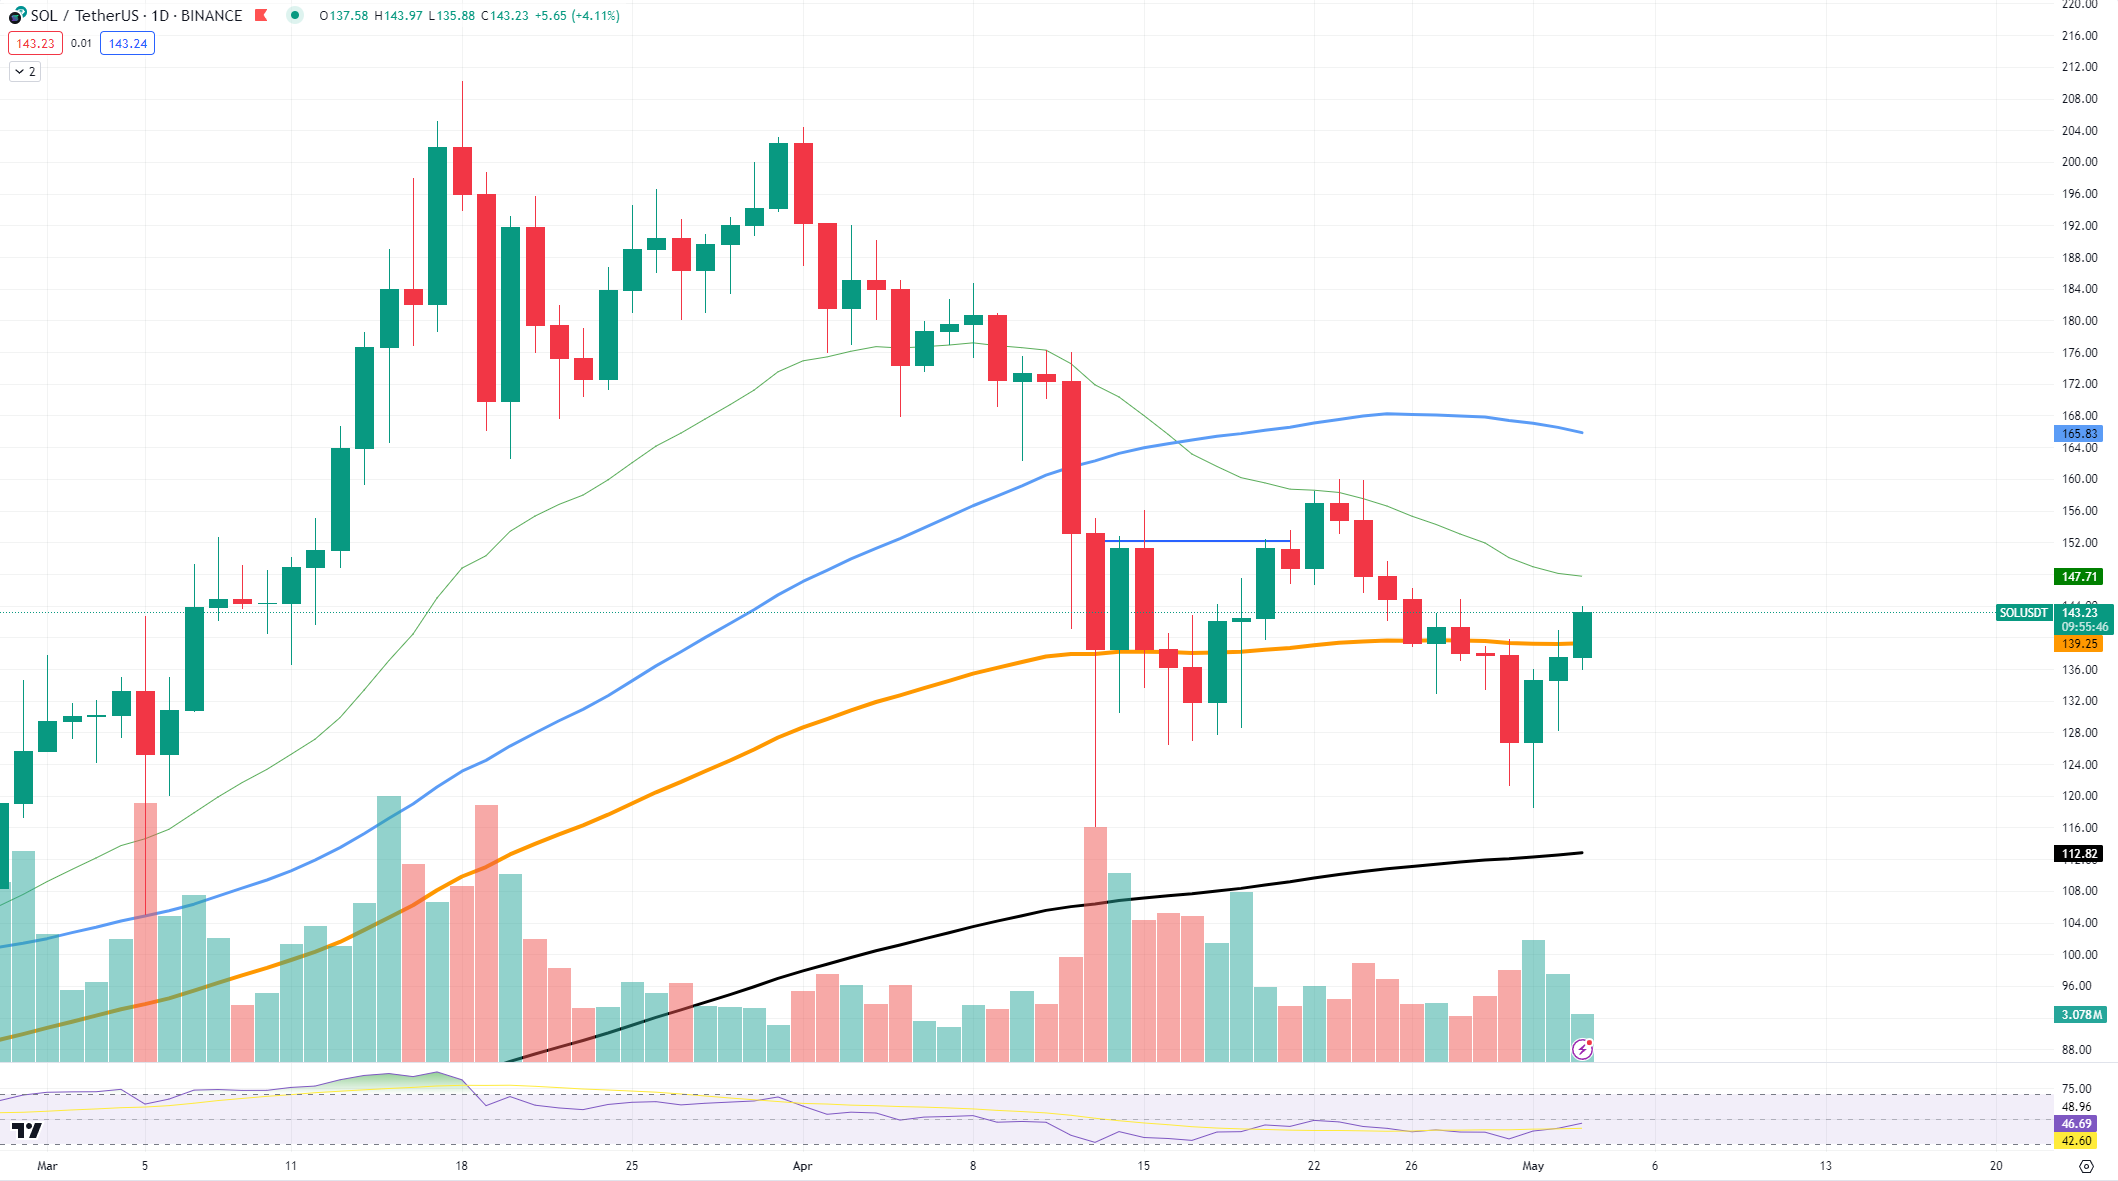
If Solana successfully breaks above the 100 EMA, the next significant resistance lies around the $150 price. Overcoming this barrier could confirm the beginning of a more sustained rebound. The increase in volume supports the breakout hypothesis, suggesting growing investor interest and potential accumulation at these levels.
On the support side, Solana finds a solid base around $115, as indicated by previous price reactions in this region. A strong bounce off this support could further solidify the foundation for its upward trajectory. However, if this level does not hold, Solana could face downward pressure, testing lower support levels, possibly around the $100 mark.
A successful rally above the 100 EMA could pave the way for a rally towards $150 and potentially higher, marking a significant recovery phase for Solana.
Bitcoin reaches crucial level
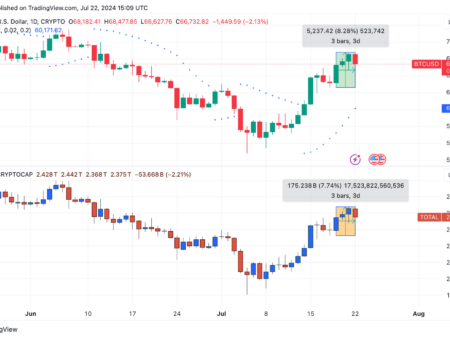
Bitcoin is once again approaching the critical $60,000 threshold, demonstrating its potential for another significant rally. Currently, the cryptocurrency is hovering around the 100-day EMA, positioned at approximately $59,000.
Despite the proximity to this key level, the current pace of the market indicates a cautious attitude among investors. Trading volume and price movements suggest a slower rise than expected, which could impact Bitcoin’s ability to smoothly surpass the $60,000 mark.
Immediate resistance after $60,000 is seen around the $63,500 mark, which Bitcoin approached but did not conclusively surpass in recent trading sessions. If Bitcoin manages to maintain the momentum and break the $60,000 resistance, this would likely set the stage for a test of higher resistances near $66,000.
On the downside, support levels are clearly visible. The most immediate solid support lies at $52,100, a level that has historically held up well in the face of bearish downturns. Should Bitcoin experience a pullback, staying above this support would be crucial to maintaining the bullish sentiment in the market.
Dogecoin’s impressive performance
The Dogecoin market shows a significant concentration of holdings, with 63% of the total Dogecoin supply in the hands of large holders, in addition to 80% profitability of the asset. This concentration can lead to greater price volatility, as the decisions of a few can significantly affect the market price. Furthermore, the composition of holders by holding time reveals that the majority, 65%, have held their tokens for more than a year, indicating strong long-term loyalty or speculation among holders.
The overall market signals for Dogecoin are mostly bearish, with on-chain signals indicating slight bearish sentiment due to a small decline in the monetary metric and large transactions. This could suggest a cautious approach by investors in response to recent price movements or broader market conditions. Exchange data reveals outflows of $278.73 million, which could indicate that some investors are moving their holdings off exchanges, possibly into private portfolios for long-term holding or in response to market uncertainty.
If you look at the Dogecoin price chart, it is currently testing a crucial support level around $0.12, which is represented by the 200 EMA. If this level holds, further declines could be avoided; However, if it breaks out, Dogecoin could post lower lows. On the upside, resistance lies near $0.15334, and a break above it could signal a possible recovery.