As Solana (SOL) continuously increases the number of unique signatories of transactions, the inherent vitality of the blockchain comes to light. SOL prices have responded positively with a sharp increase in decentralized exchange (DEX) operations over the past two weeks.
Will these indicators keep SOL price momentum in an uptrend?
Solana’s RSI is at healthy levels
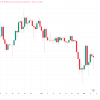
The Solana Relative Strength Index (RSI), consistently around 48, indicates limited selling pressure. It is not enough to deem the asset undervalued or push it into overbought territory. This balance suggests that Solana may be on the verge of a pivotal moment, ready for a directional price shift.

RSI Solana indicator. Source: Tradingview.
The RSI is a tool that measures the speed and magnitude of price movements, operating within a scale of zero to 100. Generally, values above 70 signal that an asset is potentially overbought, while values below 30 suggest it may be oversold. Solana’s RSI is hovering around 48 places, slightly below the midpoint, implying a slight bias from a neutral market position.
Such a balanced RSI level can lead to different scenarios for Solana. This could be a market consolidation, with price stability, as the market appears to be in a holding pattern. Traders and investors may be monitoring the asset closely, waiting for definitive signals or triggers that could indicate the direction of the next significant price movement.
However, other parameters suggest the second case, which would be a preview of a breakout, in which the uptrend will continue despite the RSI being above 30.
Solana could soon reach 1 million daily users
Solana’s on-chain data shows us two interesting metrics. The first is the incredible number of DEX trades, which reached 6.5 million on March 10th. This is the highest number of daily DEX trades on Solana ever recorded, and since February 26, the number of trades on decentralized exchanges in the Solana ecosystem has grown steadily. , always remaining above 2 million per day. Before December 2023, the maximum daily number of DEX trades on Solana was 2.2 million.
This suggests that users are increasingly interacting with dApps on Solana, leading to increased use of SOL for trading tokens on its decentralized exchanges. As a result, this increased activity and speculation on SOL could directly affect its price.
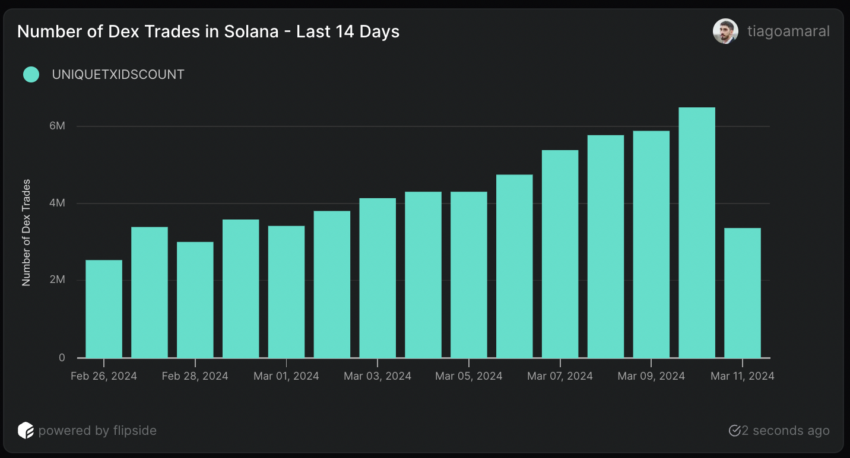
Number of Dex exchanges in Solana. Source: Flipside.
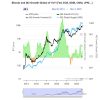
Another interesting on-chain metric to check is daily unique signatories of transactions. In simple terms, the number of unique users who pass through the network daily.
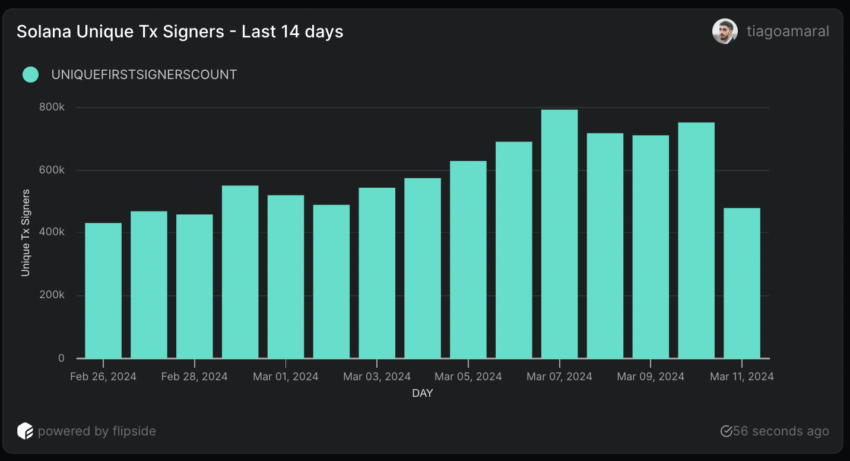
Solana’s Unique Tx Signatories. Source: Flipside.
This number has been steadily growing since January 2024. On February 26, this metric recorded 432,000 users. On March 7, it grew to nearly 800,000, an 85% growth. This growth in less than a month is noteworthy for an already large chain like Solana.
Following the same growth rate for the next few weeks could bring Solana’s daily unique users to 1,000,000 in less than 14 days.
SOL Price Prediction: Eyeing $200
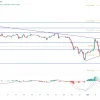
Solana (SOL) is showing a resistance level of $150 and a support level of $148.00. These critical levels were identified based on historical price movements where Solana has consistently encountered significant buying or selling resistance.
Breaking the $150 resistance threshold could potentially launch Solana into a new uptrend, which could reach $200. This upward momentum could be fueled by an influx of users joining the Solana network and an increase in trading activity on decentralized exchanges (DEXs) associated with the network.
Even after Binance suspended Solana withdrawals, this did not affect the SOL price much.
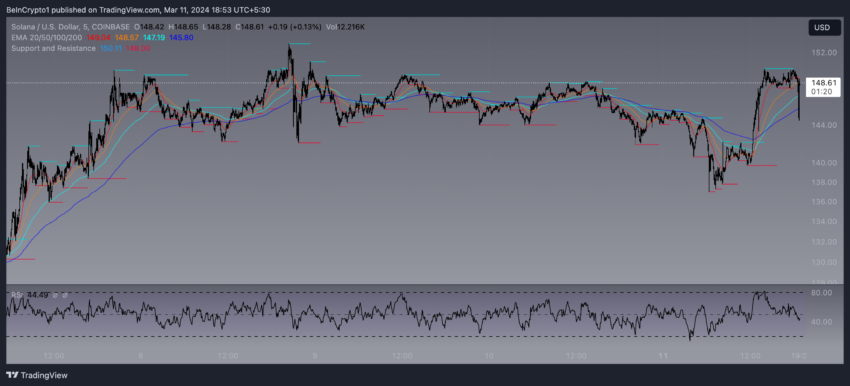
Solana resistance and supports. Source: Tradingview.
On the other hand, if Solana fails to maintain the position above the $144 support level, there is a risk that the price could slide lower towards $140; it could retreat further to reach the $138 threshold. Monitoring these support and resistance levels carefully is crucial, as they can offer insight into SOL’s short-term price trajectory in the cryptocurrency market.
Analysis of the cross EMA (exponential moving average) for 20, 50, 100 and 200 days shows us that the short-term EMAs are crossing above the long-term EMAs, a bullish sign. This indicates that the price of SOL may continue to rise in the coming days.
