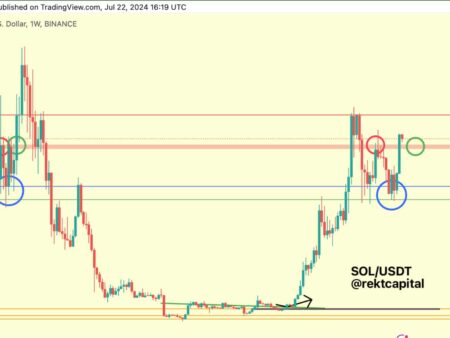
Bitcoin has seen a substantial rally, breaking through several resistance levels with a vigor that points to positive market sentiment. Currently, the price is around $56,000. A critical observation is the lack of volatility preceding this surge, which appears to have contributed to a brief squeeze, catching bearish traders by surprise and driving the price higher as they rushed to cover their positions.
Bitcoin has seen a substantial rally, breaking through several resistance levels with a vigor that points to positive market sentiment. Currently, the price is around $56,000. A critical observation is the lack of volatility preceding this surge, which appears to have contributed to a brief squeeze, catching bearish traders by surprise and driving the price higher as they rushed to cover their positions.
Support levels for Bitcoin are now set at $53,000 and $49,645, which align with the recent consolidation range and 50-day moving average, respectively. These levels are crucial for Bitcoin to maintain its bullish momentum. On the resistance side, the immediate hurdle lies at $58,000, followed by the psychological and substantial barrier at $60,000.
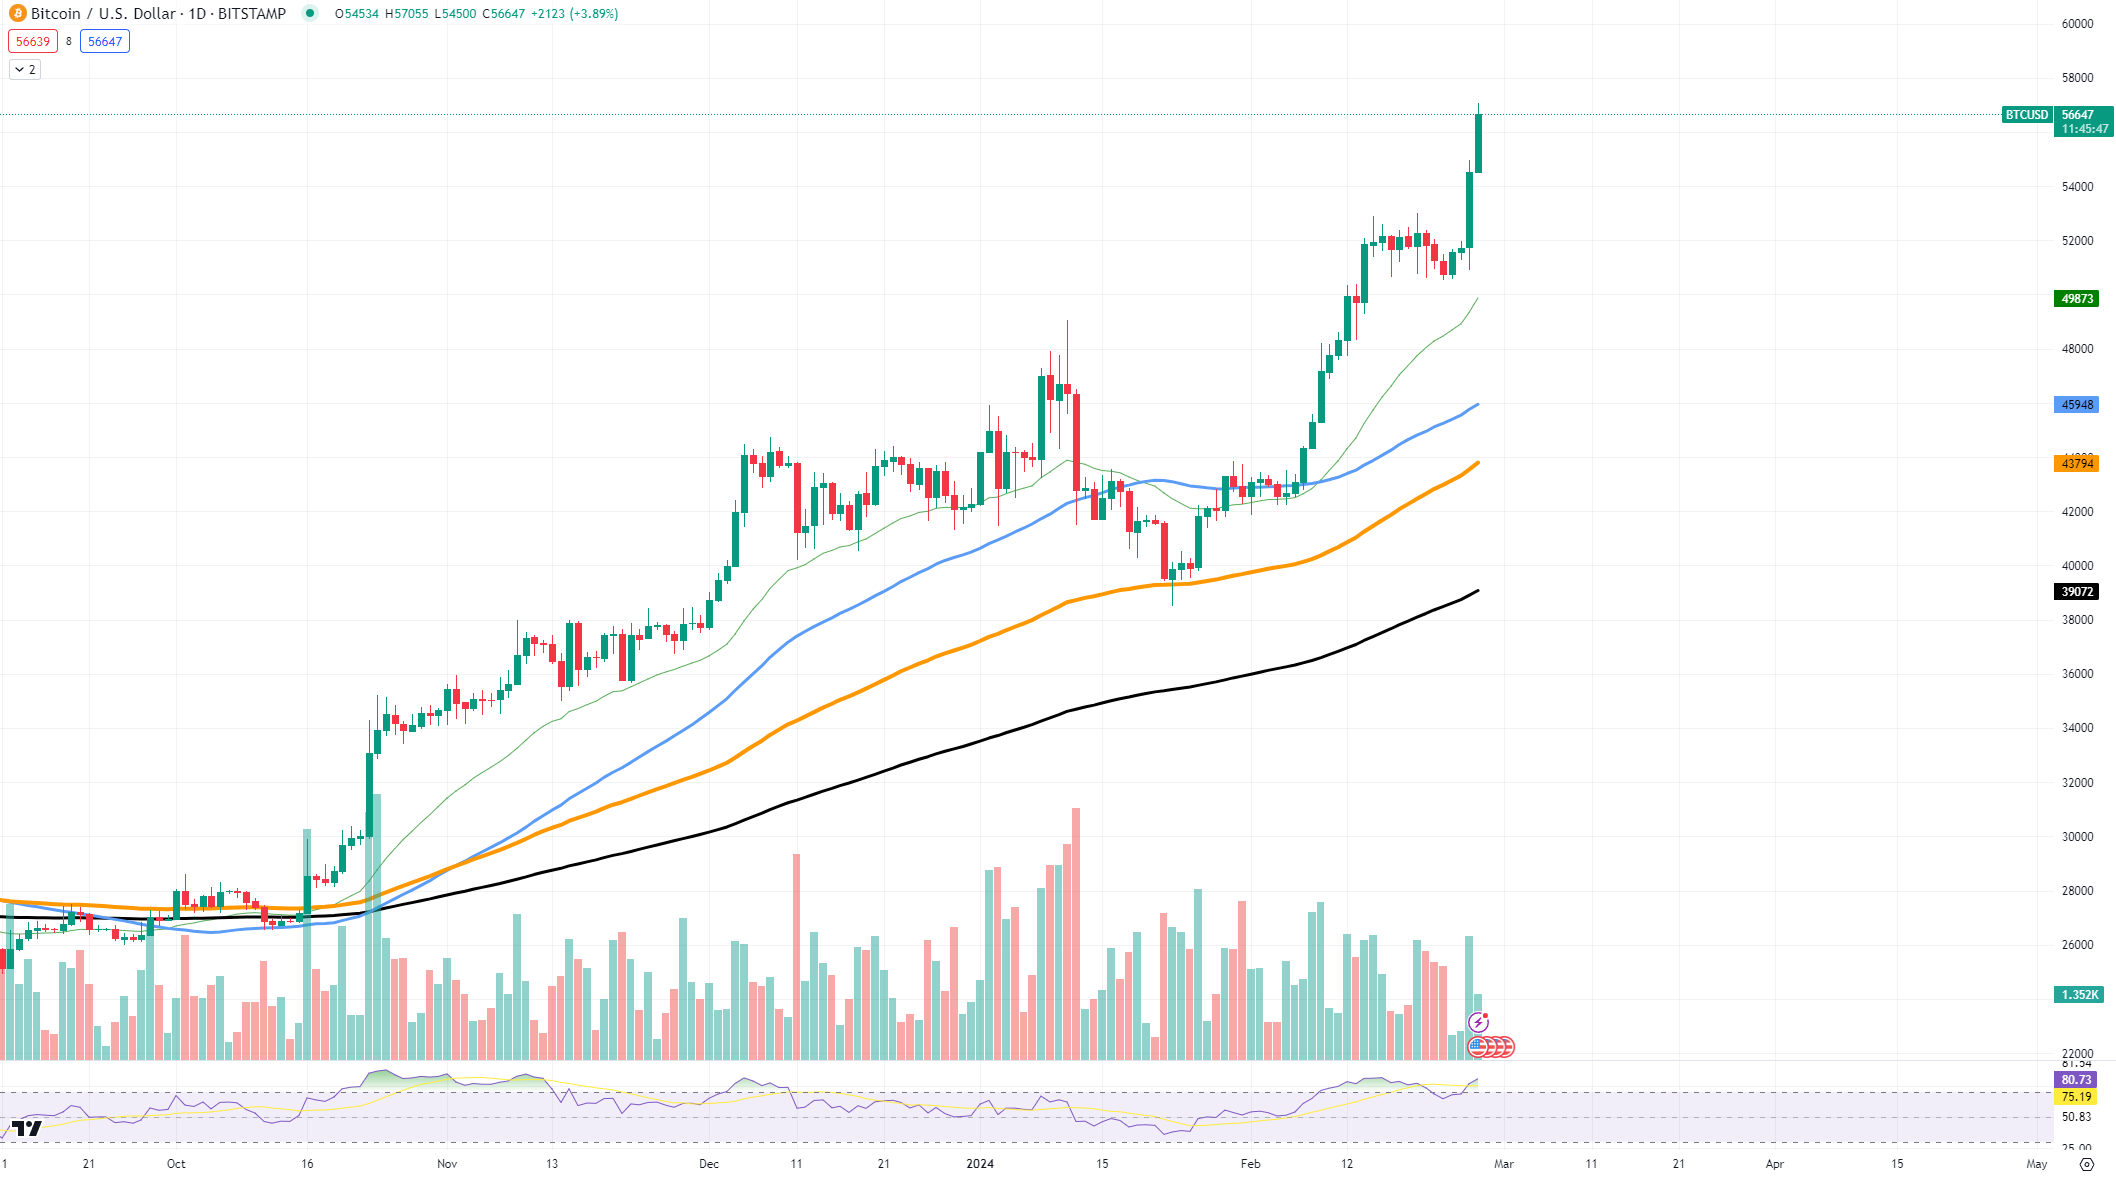
Bitcoin is trending bullish, with the asset trading well above its moving averages, a sign that could indicate sustained bullish pressure. Trading volume has seen a significant increase during the rally, suggesting strong buyer interest and the possibility of a continued upward move.
In a bullish scenario, if Bitcoin can overcome the $58,000 resistance, it could well be on its way to testing the $60,000 threshold. Such a move would likely require continued institutional interest, positive developments in the cryptocurrency space, and maintenance of a favorable macroeconomic environment.
Ethereum’s leadership
Ethereum has seen a solid uptrend, with the price currently floating around $3,225. The bullish momentum has pushed ETH well above its moving averages, and it looks like the next target will be the long-awaited price of $3,500. The 50-day moving average, currently near $2,650, followed by the 100-day moving average at $2,414, are key supports that have historically driven prices higher by retesting.
As for resistance, Ethereum is looking to challenge the $3,300 level, having recently surpassed it. A sustained move above this level could open the door to $3,500, a psychological and technical barrier that may generate some selling pressure. However, the strength of the current trend suggests that this resistance could be tested soon.
Ethereum’s trend is decidedly bullish, with a steep and constant price increase. However, the asset appears to be in overheated territory, as indicated by the Relative Strength Index, which hovers around overbought conditions. A divergence could also be forming, as the RSI does not confirm the new highs the price is reaching, which could be an early sign of a possible pullback.
If the buying pressure stays its course, Ethereum could comfortably reach and potentially surpass $3,500. This would likely be driven by continued positive market sentiment, advancements in the Ethereum network, and growing adoption of its blockchain.
Dogecoin eyes a breakthrough
Dogecoin is currently at a crucial point that could define its trajectory in the coming weeks. DOGE is currently trading around $0.09152 and has been seeing increased buying pressure, pushing it towards a key resistance level at $0.092. This level is significant not only because of the psychological effect of the round number, but also because it has served as a strong resistance point in the past. A break above this level could signal strong bullish momentum, which could lead to performance highs not yet seen for the token.
Support for DOGE is currently set at $0.08451, which aligns with the 50-day moving average. Historically, this moving average has provided support during uptrends, offering a rebound point for prices after pullbacks. More support is found at $0.08216, marked by recent lows that have been tested and held firm.
DOGE’s trend is currently bullish, with the price above the 50-day and 100-day moving averages, indicating positive sentiment among traders. The moving averages are sloping upward, suggesting that the trend has strength and may continue.