Veteran trader Peter Brandt has once again caught the attention of the cryptocurrency community, this time with his Ethereum chart analysis, which he describes as “very intriguing.”
Veteran trader Peter Brandt has once again caught the attention of the cryptocurrency community, this time with his Ethereum chart analysis, which he describes as “very intriguing.”
Brandt, known for his deep analysis and decades of experience in the financial markets, shared his perspective on Ethereum’s price action, sparking debate among traders and investors.
Ethereum, the second-largest cryptocurrency by market value, has shown interesting activity on the charts, catching the attention of analysts like Brandt.
Brandt’s analysis comes at a crucial time for Ethereum, as the cryptocurrency market goes through a period of volatility and uncertainty. Bitcoin, the first and largest cryptocurrency by market capitalization, fell to intraday lows of $60,601, after three days of losses.
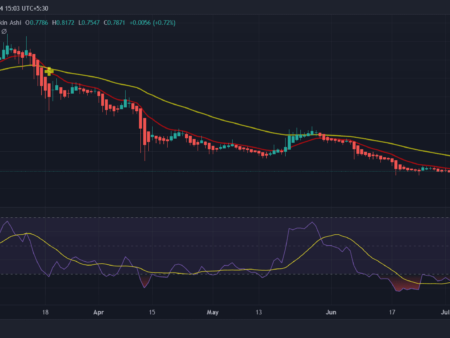
Ethereum also mirrored BTC’s price action, falling over three days to a low of $2,937 on May 8. At the time of writing, Ethereum was trading below $3,000, down 1.05% in the last 24 hours at $2,972.
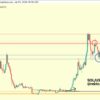
In his analysis, Brandt Consider two chart patterns to assess Ethereum’s potential trajectory. Unable to completely settle on either of these two patterns, Brandt characterizes the Ethereum chart as “very intriguing.”
In one case, Brandt considered the pattern he highlighted on the ETH price chart to resemble a flag: a continuation pattern that often appears during a brief pause in a bullish or bearish trend.
He argues that, due to its length, the pattern might not be considered a flag, but a channel seems the most likely label. A channel is formed when price action is controlled by two parallel sloping lines and price has tested each of these lines at least twice. A flag can appear as a small channel after a pronounced trend, which develops in the opposite direction.
The Ethereum chart, according to Brandt, deserves careful consideration and analysis given the uncertainty over upcoming price movements. Whether it is a flag or a channel, both have the potential for a breakout in both directions, whether up or down. “It could go either way with this graph,” Brandt explained.