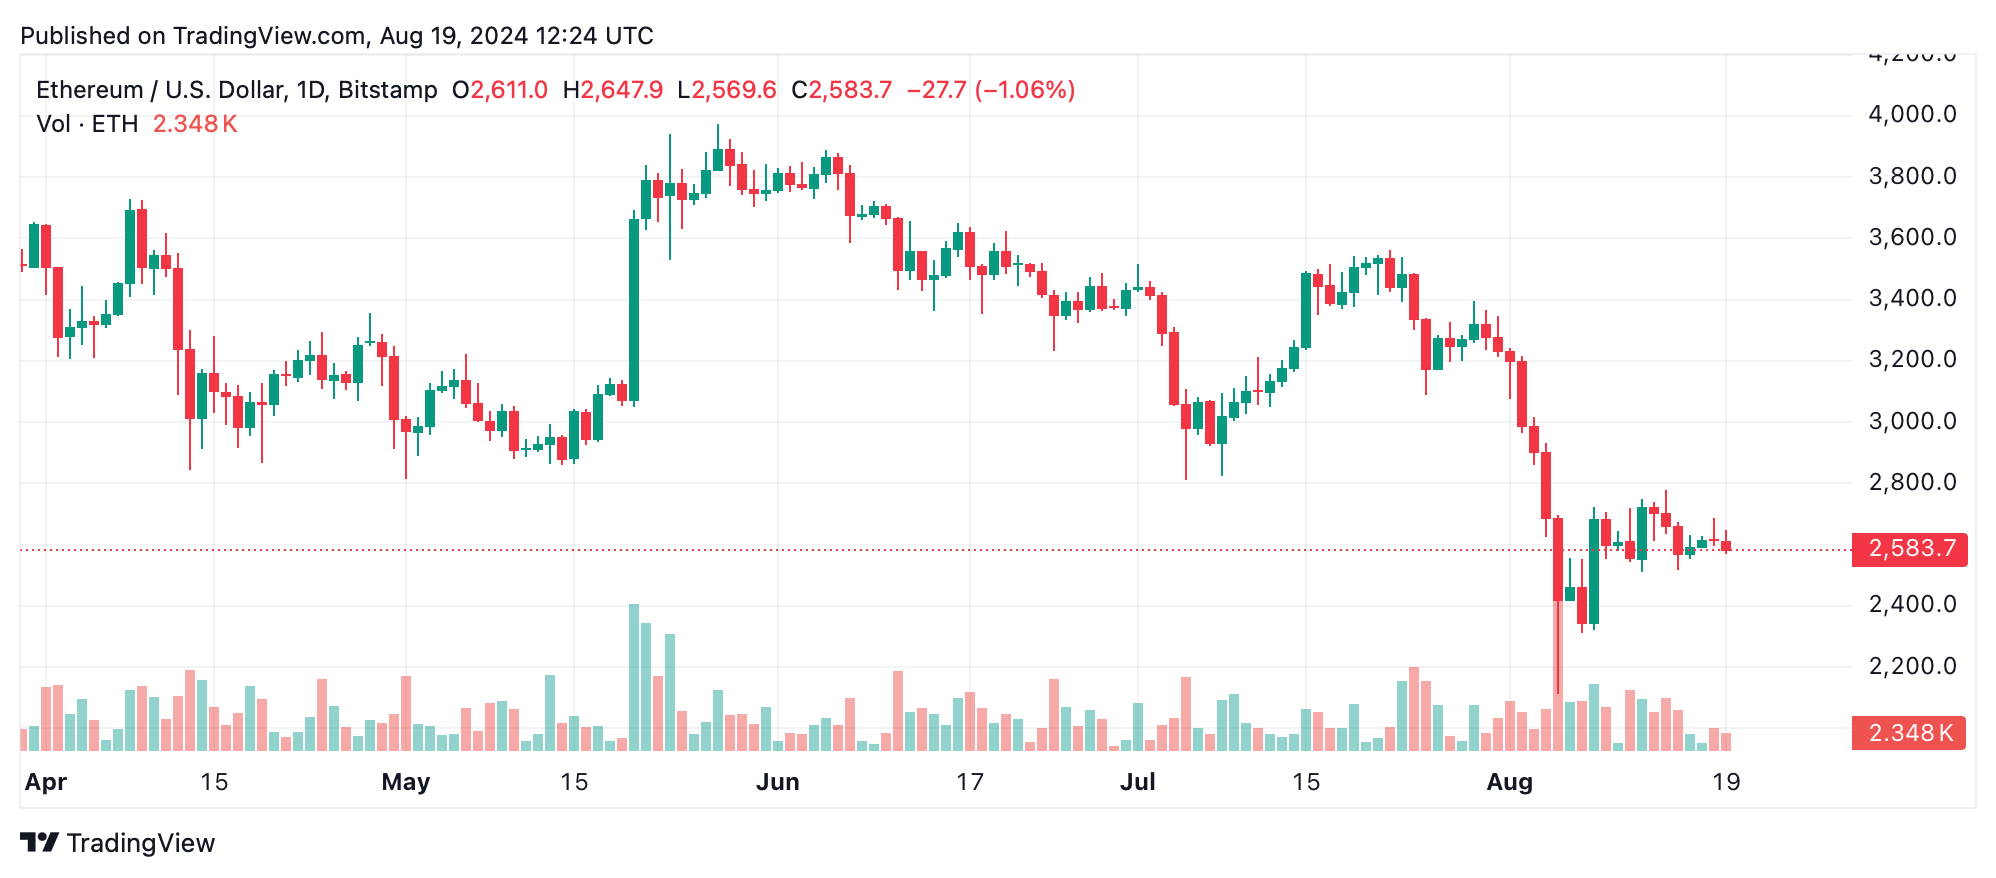
The Ethereum price on August 19, 2024 is $2,582, with a 24-hour intraday range of $2,572 to $2,681. The cryptocurrency’s trading volume was $9.5 billion, contributing to a market cap of $310 billion. Despite these figures, Ethereum’s technical indicators are bearish, signaling traders to proceed with caution.
Ethereum
The Ethereum daily chart paints a clear picture of the prevailing bearish trend. After a sharp decline from $3,565 to a low of around $2017, the market is showing signs of indecision, characterized by small movements. Volume analysis further confirms this sentiment, with a volume spike near the recent low signaling a potential capitulation point. Support is around $2017, while resistance is expected in the $2,800 to $3,000 range, where previous support has turned into resistance.
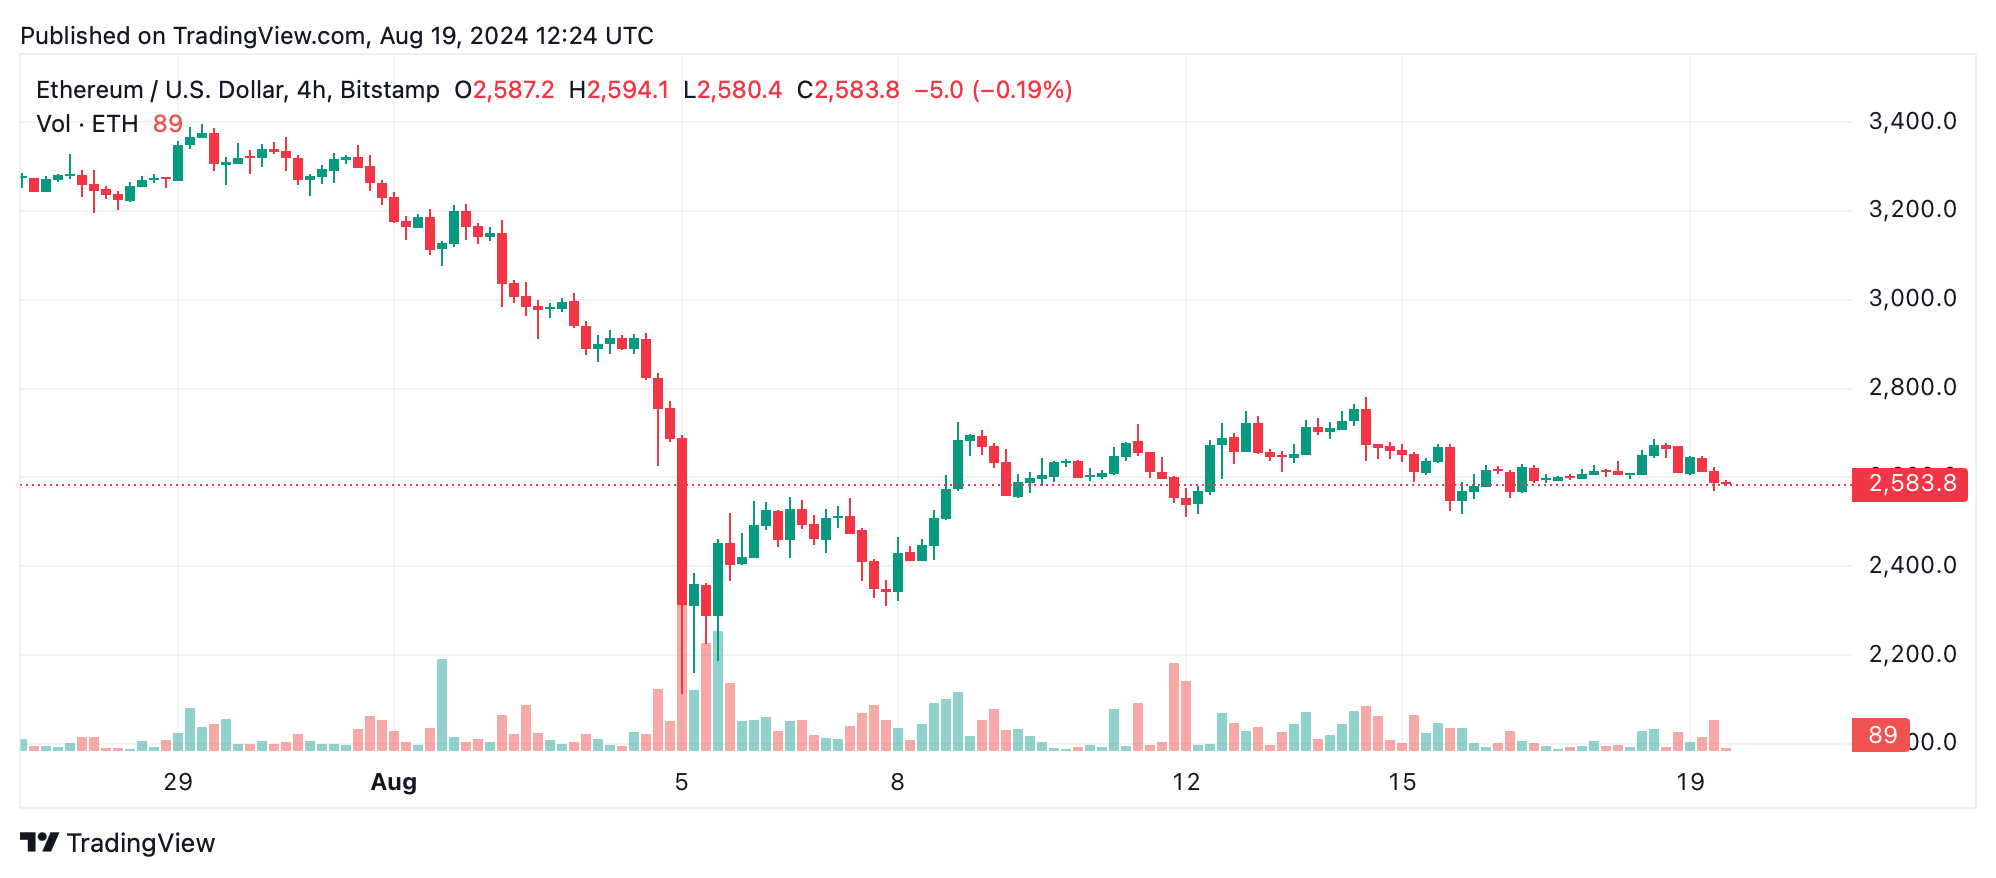
On the 4-hour chart, ethereum continues its downward trajectory with lower highs and lower lows, highlighted by the recent sharp drop to $2,515 followed by a modest recovery. Volume spikes on the dips indicate strong selling pressure, especially during the decline. Support is now located near $2,515, and resistance is near $2,700, where the price pulled back before moving lower again.
The 1-hour chart shows a micro downtrend in a broader bearish context. After falling to $2,565, Ethereum attempted to recover but struggled to gain momentum. Volume remains low, with only a few spikes on major declines, suggesting that selling pressure may persist. Key support is found around $2,565, while resistance is at $2,688.
Oscillators across multiple time frames are largely neutral, with the Relative Strength Index (RSI) at 38.9, Stochastics at 64.8, and Commodity Channel Index (CCI) at -38.1. However, momentum indicators such as the Moving Average Convergence Divergence (MACD) at -145.8 are offering a buy signal, indicating potential for a short-term bounce. However, overall sentiment remains cautious with strong bearish signals from the 10-, 20-, 50-, 100-, and 200-day moving averages, all of which are pointing to negative sentiment.
Bull’s Verdict:
Despite the prevailing bearish sentiment, a potential short-term reversal could be on the horizon, as suggested by buy signals from momentum indicators such as the MACD. If ethereum can hold above the $2,600 support level and gain momentum, there could be room for a bullish bounce towards the $2,700-$2,800 resistance levels. However, this forecast requires careful monitoring of volume and price action to confirm any bullish momentum.
The bear’s verdict:
The overall technical landscape for ethereum remains bearish, with strong resistance and persistent selling pressure across all time frames. Consistent selling signals from moving averages and a struggle for momentum suggest that ethereum may continue to face downward pressure. Barring a significant change in market dynamics, the path of least resistance appears to be lower, with key support levels at risk of being tested.
