The market’s favorite meme cryptocurrency, Dogecoin, is giving off signals that could indicate where it is headed next. Recently, the asset has shown a downward volume trend, which is often considered a warning sign of a possible price drop.
The market’s favorite meme cryptocurrency, Dogecoin, is giving off signals that could indicate where it is headed next. Recently, the asset has shown a downward volume trend, which is often considered a warning sign of a possible price drop.
By examining the current price chart, we can identify the local support level for DOGE at around $0.1048, a point where the price previously stabilized before recovering. On the upside, there is a clear resistance level around $0.1439, which has been tested but not overcome convincingly in recent trading sessions.
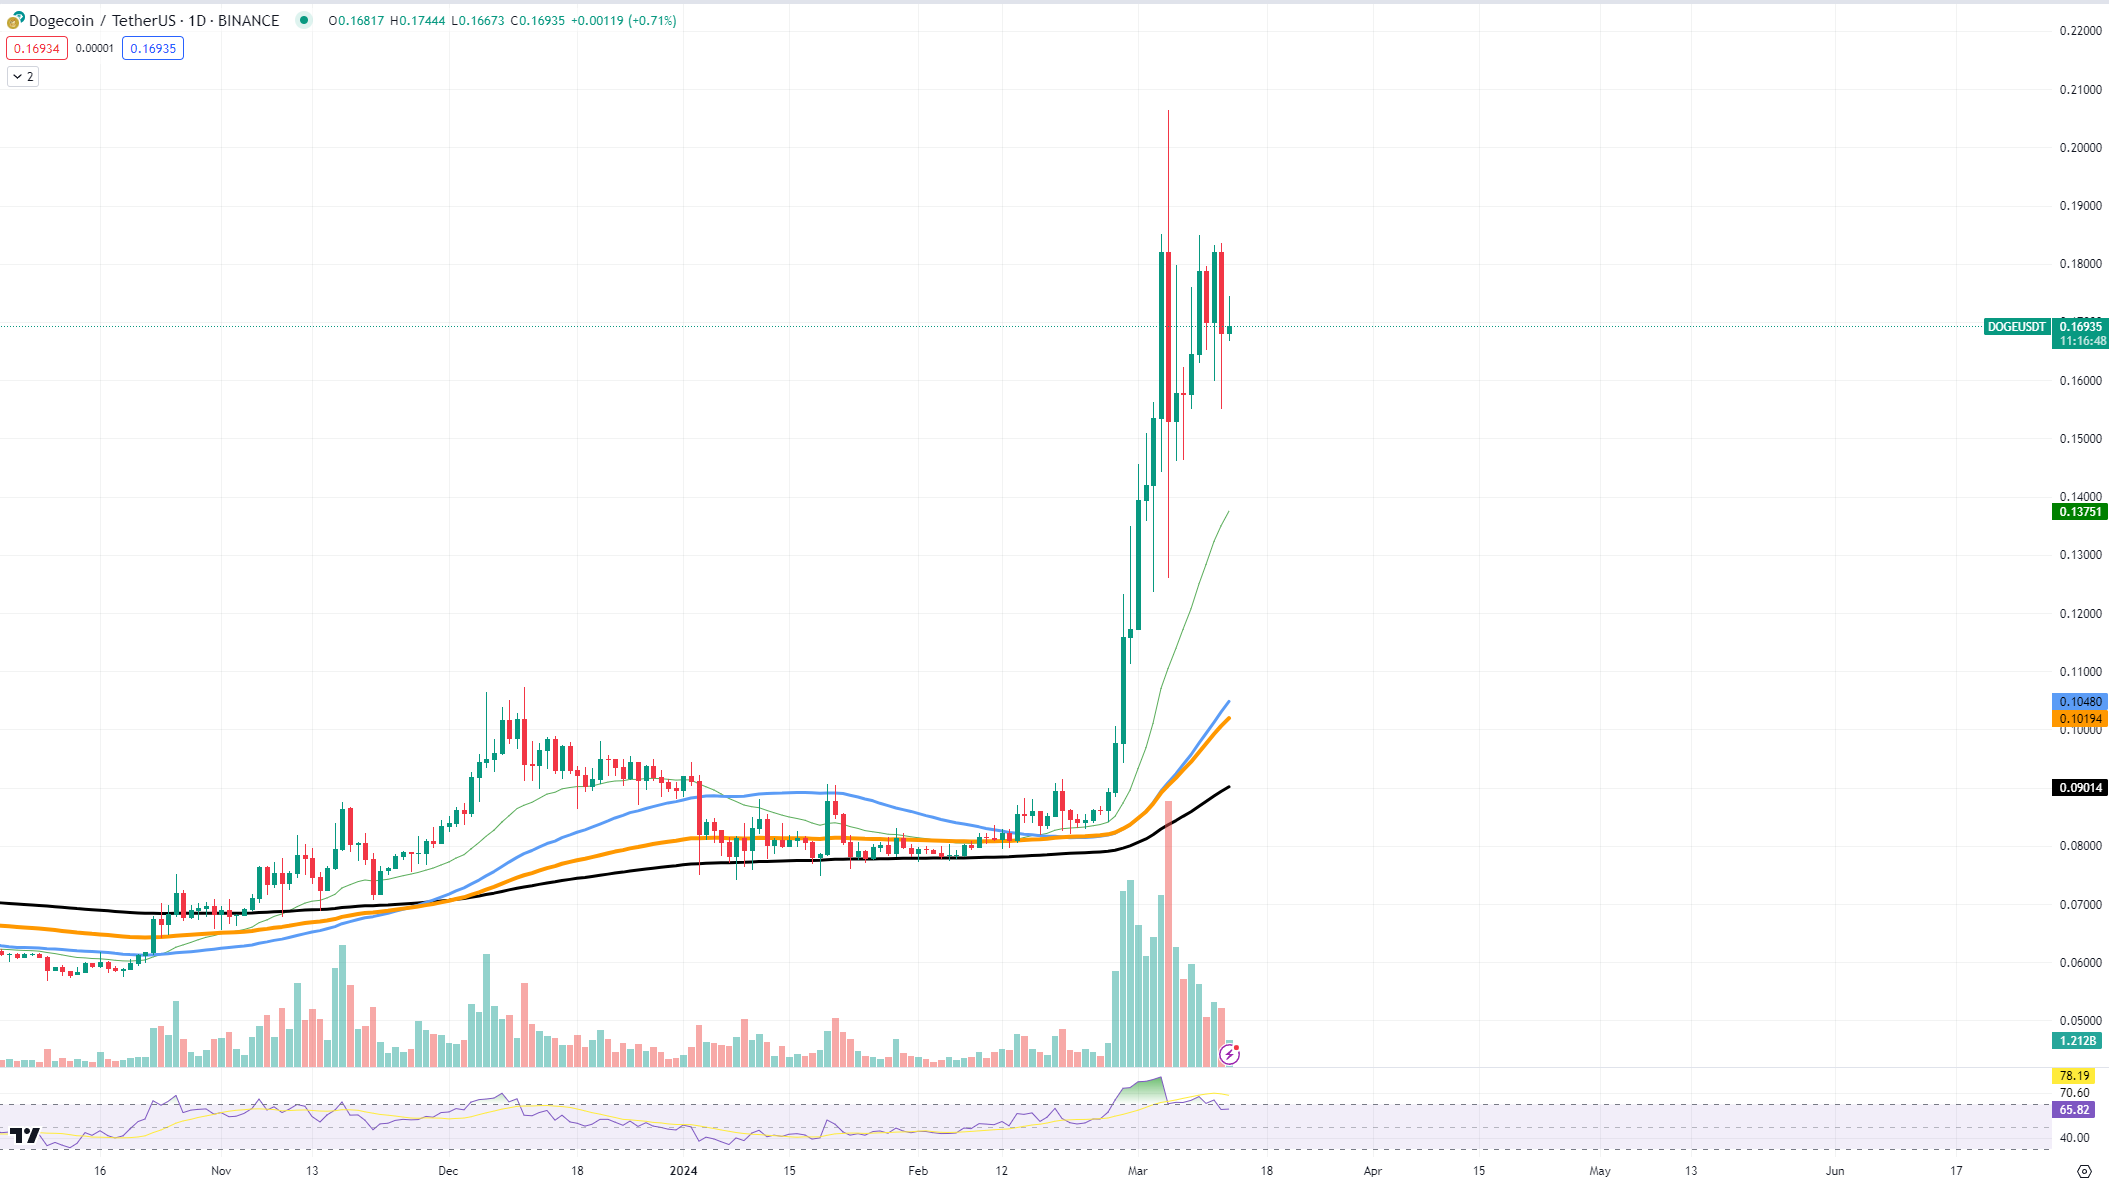
The downward trend in volume coincides with a stabilization of the price after a significant increase. This pattern suggests that while interest in purchasing DOGE at higher prices is decreasing, the market is losing the momentum needed to sustain the upward movement.
This does not necessarily guarantee a decline, as other market factors could come into play to revitalize buyer interest. However, if DOGE falls below current support with continued low volume, it could validate a bearish outlook, setting the stage for further declines.
Cardano faces problems
Cardano is exhibiting patterns that have attracted attention in the trading community. A closer look at the charts suggests a formation that resembles a double top pattern. This pattern, a bearish technical reversal pattern, emerges after an asset reaches a high price twice in a row with a moderate decline between the two highs.
It is visually identified by two peaks at approximately the same price level and is often followed by a drop in value, indicating that the asset is facing resistance at this high point and may not be able to overcome it.
Analyzing the recent ADA chart, the token is showing two distinct peaks, indicating strong resistance at that level. The first high appears to have been met with a massive sell-off that brought prices down, only for them to rise again to a similar level, forming the second high.
The support level for ADA currently lies around $0.580, marked by previous consolidations. If the double top pattern holds, we may see the price fall towards this support level.
Resistance, which coincides with the peaks of the double top, is around the $0.738 mark. A break above this level would invalidate the double top scenario, which could lead to bullish continuation.
Shiba Inu enters correction
The market has been watching Shiba Inu closely as the asset has recently shown signs of a price correction. The much talked about cryptocurrency, which has enjoyed substantial growth, is now facing the reality of market mechanics with a possible reversal on the horizon.
The current price chart indicates that SHIB has encountered resistance at the $0.00003888 level, where the bullish momentum has started to falter. This resistance mark is critical as it has been tested several times and the asset struggles to maintain a stable rise beyond this point.
On the downside, support levels are now clearly in focus. The first notable support lies around the $0.00003286 mark, which could play a vital role if the downtrend continues. A break below this level could trigger a fresh sell-off, which could lead SHIB to test the next support level near $0.00002920.
One of the telltale signs of the beginning of a correction phase is increasing selling pressure, along with a decrease in buying momentum. This combination usually precedes a downtrend as it indicates a change in trader sentiment from bullish to bearish.
If SHIB fails to hold above its immediate support level, we could see the price fall towards the lower support at $0.00002836, where there may be an opportunity for the bulls to try to regain control.