Leading meme coin Dogecoin (DOGE) has been moving in a horizontal channel since August 8. Over the past few days, it has approached the resistance level, trying to break above it.
However, there is a negative divergence between its price and trading volume, which may prevent a breakout.
Dogecoin Faces Headwinds
When an asset is trading in a horizontal channel, it moves sideways while remaining within a certain range due to the balance between buying and selling pressure. The upper line of the channel represents resistance, while the lower line acts as support.
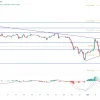
Since August 8, DOGE has encountered resistance at $0.10 and found support at $0.09. The recent rally to the resistance line has been driven by a 4% price increase over the past seven days.
However, during this period, daily trading volume fell by 37%, creating a negative divergence between price and volume. This divergence suggests that the rally may not be strong enough, potentially leading to a decline in price.
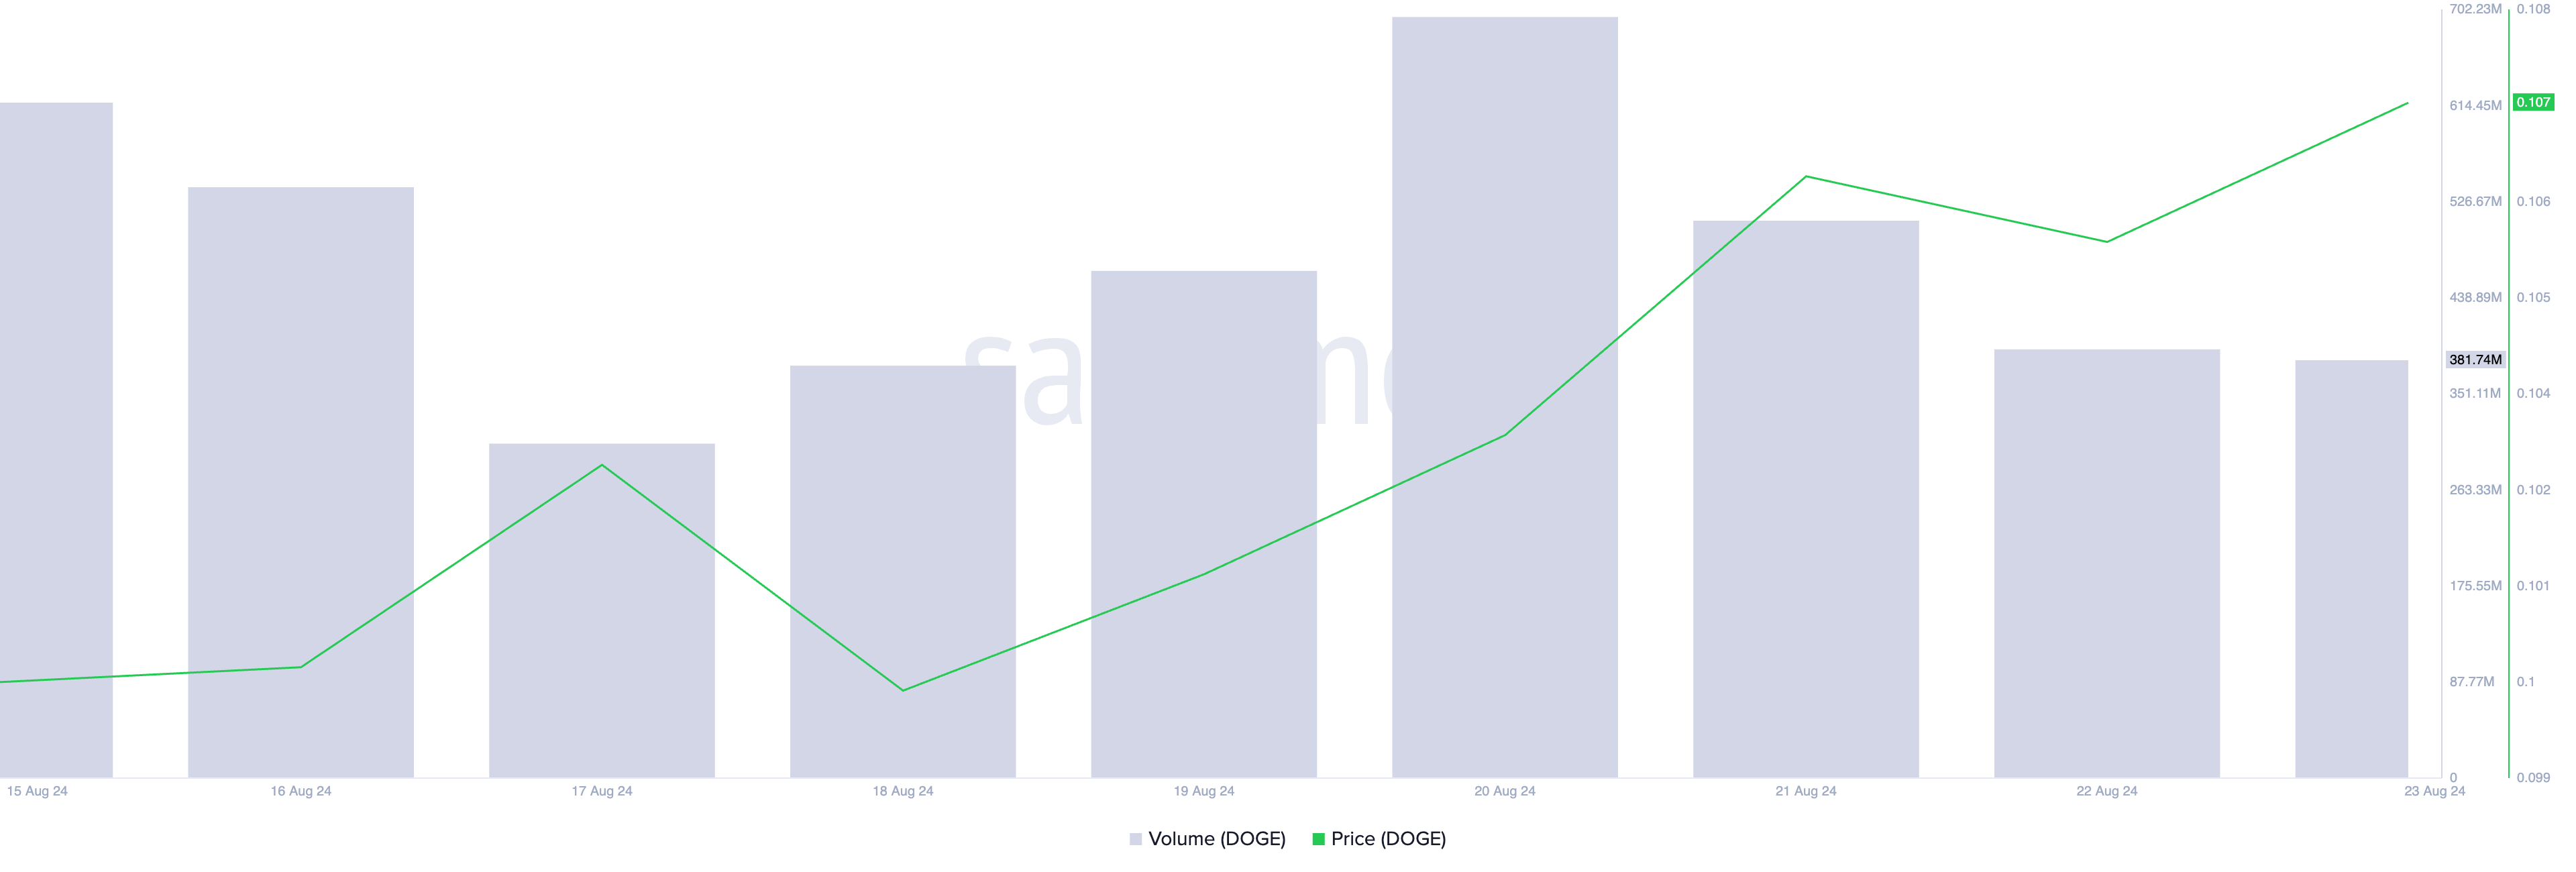
In a healthy uptrend, an asset’s price rise is usually supported by rising trading volume, which indicates that more participants are buying the asset. However, when the price rises and trading volume falls, it indicates that buying momentum is waning. This suggests that only a limited number of traders are driving the rally, making it vulnerable to exhaustion, which could cause the price to fall.
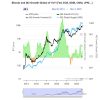
The risk of this scenario is heightened for DOGE as it currently lacks strong whale activity. Large holders have reduced their trading activity over the past week, as evidenced by a 100% drop in net large holder flow, according to IntoTheBlock.
Read more: Dogecoin (DOGE) vs Shiba Inu (SHIB): What’s the Difference?
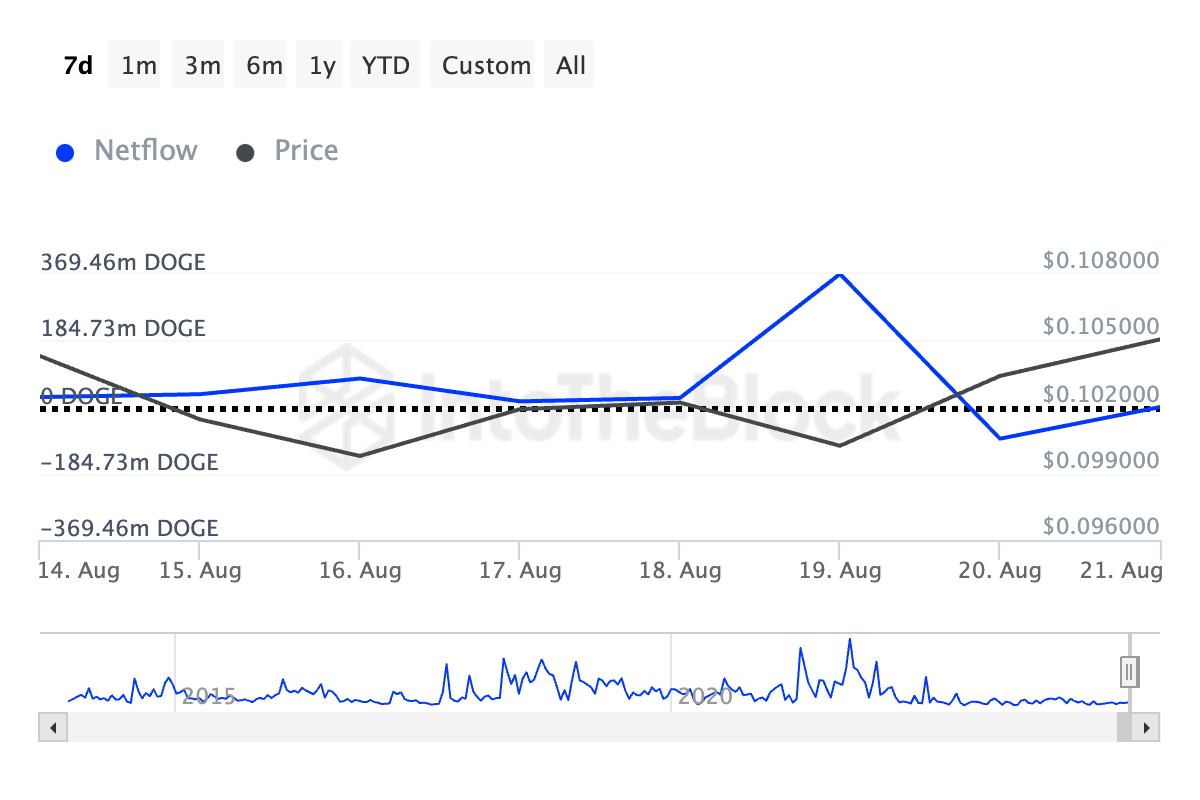
When the net flow of large holders of an asset falls, it is a bearish signal. This means that its whale addresses are selling their assets, putting the price at risk.
DOGE Price Forecast: Bulls Resist
Despite the negative divergence between DOGE price and daily trading volume, as well as the recent drop in whale activity, bulls are working to regain control of the market. This is evident from the positive readings of the Elder-Ray DOGE index since August 20, after previously showing only negative values.
The Elder-Ray Index measures the strength of buyers versus sellers in the market. Positive readings indicate growing strength among bulls. The Elder-Ray DOGE Index is currently at 0.0037, signaling a potential shift in momentum toward the bulls.
Additionally, although DOGE has been trading sideways in the past few weeks, its Parabolic Stop and Reverse (SAR) indicator dots have been below its price since August 10. This indicator tracks the direction of an asset’s price and identifies potential reversal points. When its dots are below the asset’s price, buyers are in control, pushing prices higher.
Read More: Dogecoin (DOGE) Price Prediction 2024/2025/2030
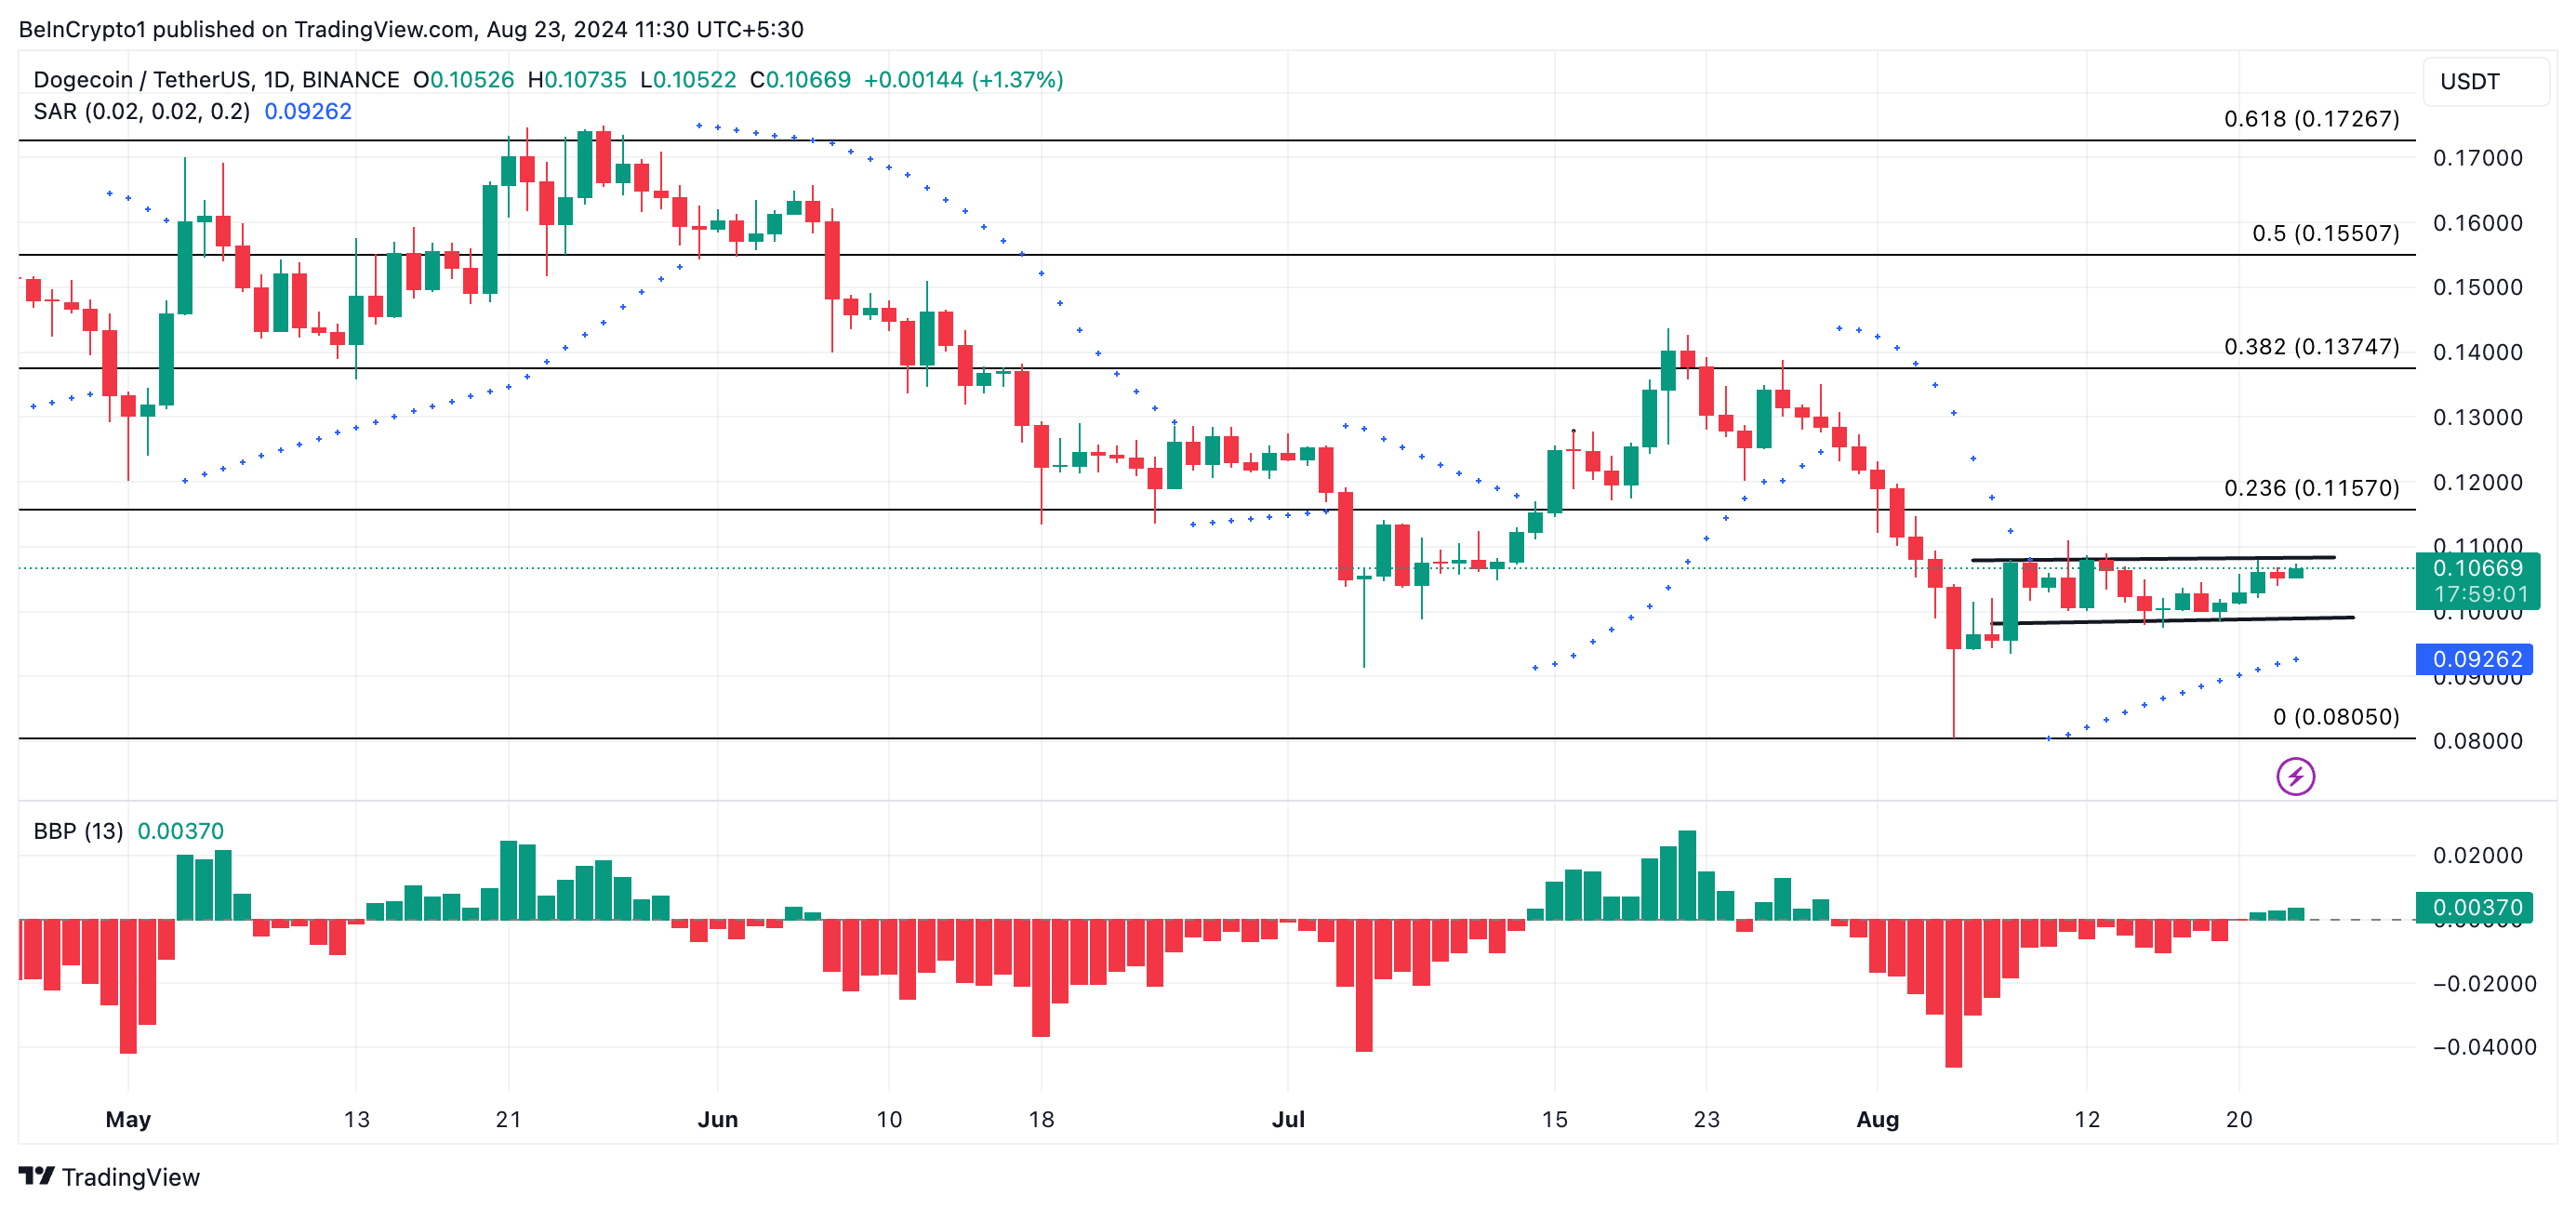
If DOGE successfully breaks out of the upper line of its horizontal channel, its price will rise to $0.11. Conversely, a failed breakout could see the price retreat to the $0.09 support and potentially fall below it to $0.08, invalidating the bullish projection.
