After a promising rally, Ethereum price failed to break above the expected resistance level, leaving investors pondering its future trajectory. So, did the Ethereum recovery attempt fail? The charts suggest a pause.
After a promising rally, Ethereum price failed to break above the expected resistance level, leaving investors pondering its future trajectory. So, did the Ethereum recovery attempt fail? The charts suggest a pause.
A closer look at the price movement reveals ETH’s resistance. After a sharp rise to around $3,500, Ethereum looked poised to break through and set new highs. However, it appears to have stumbled near the $3,491 mark.
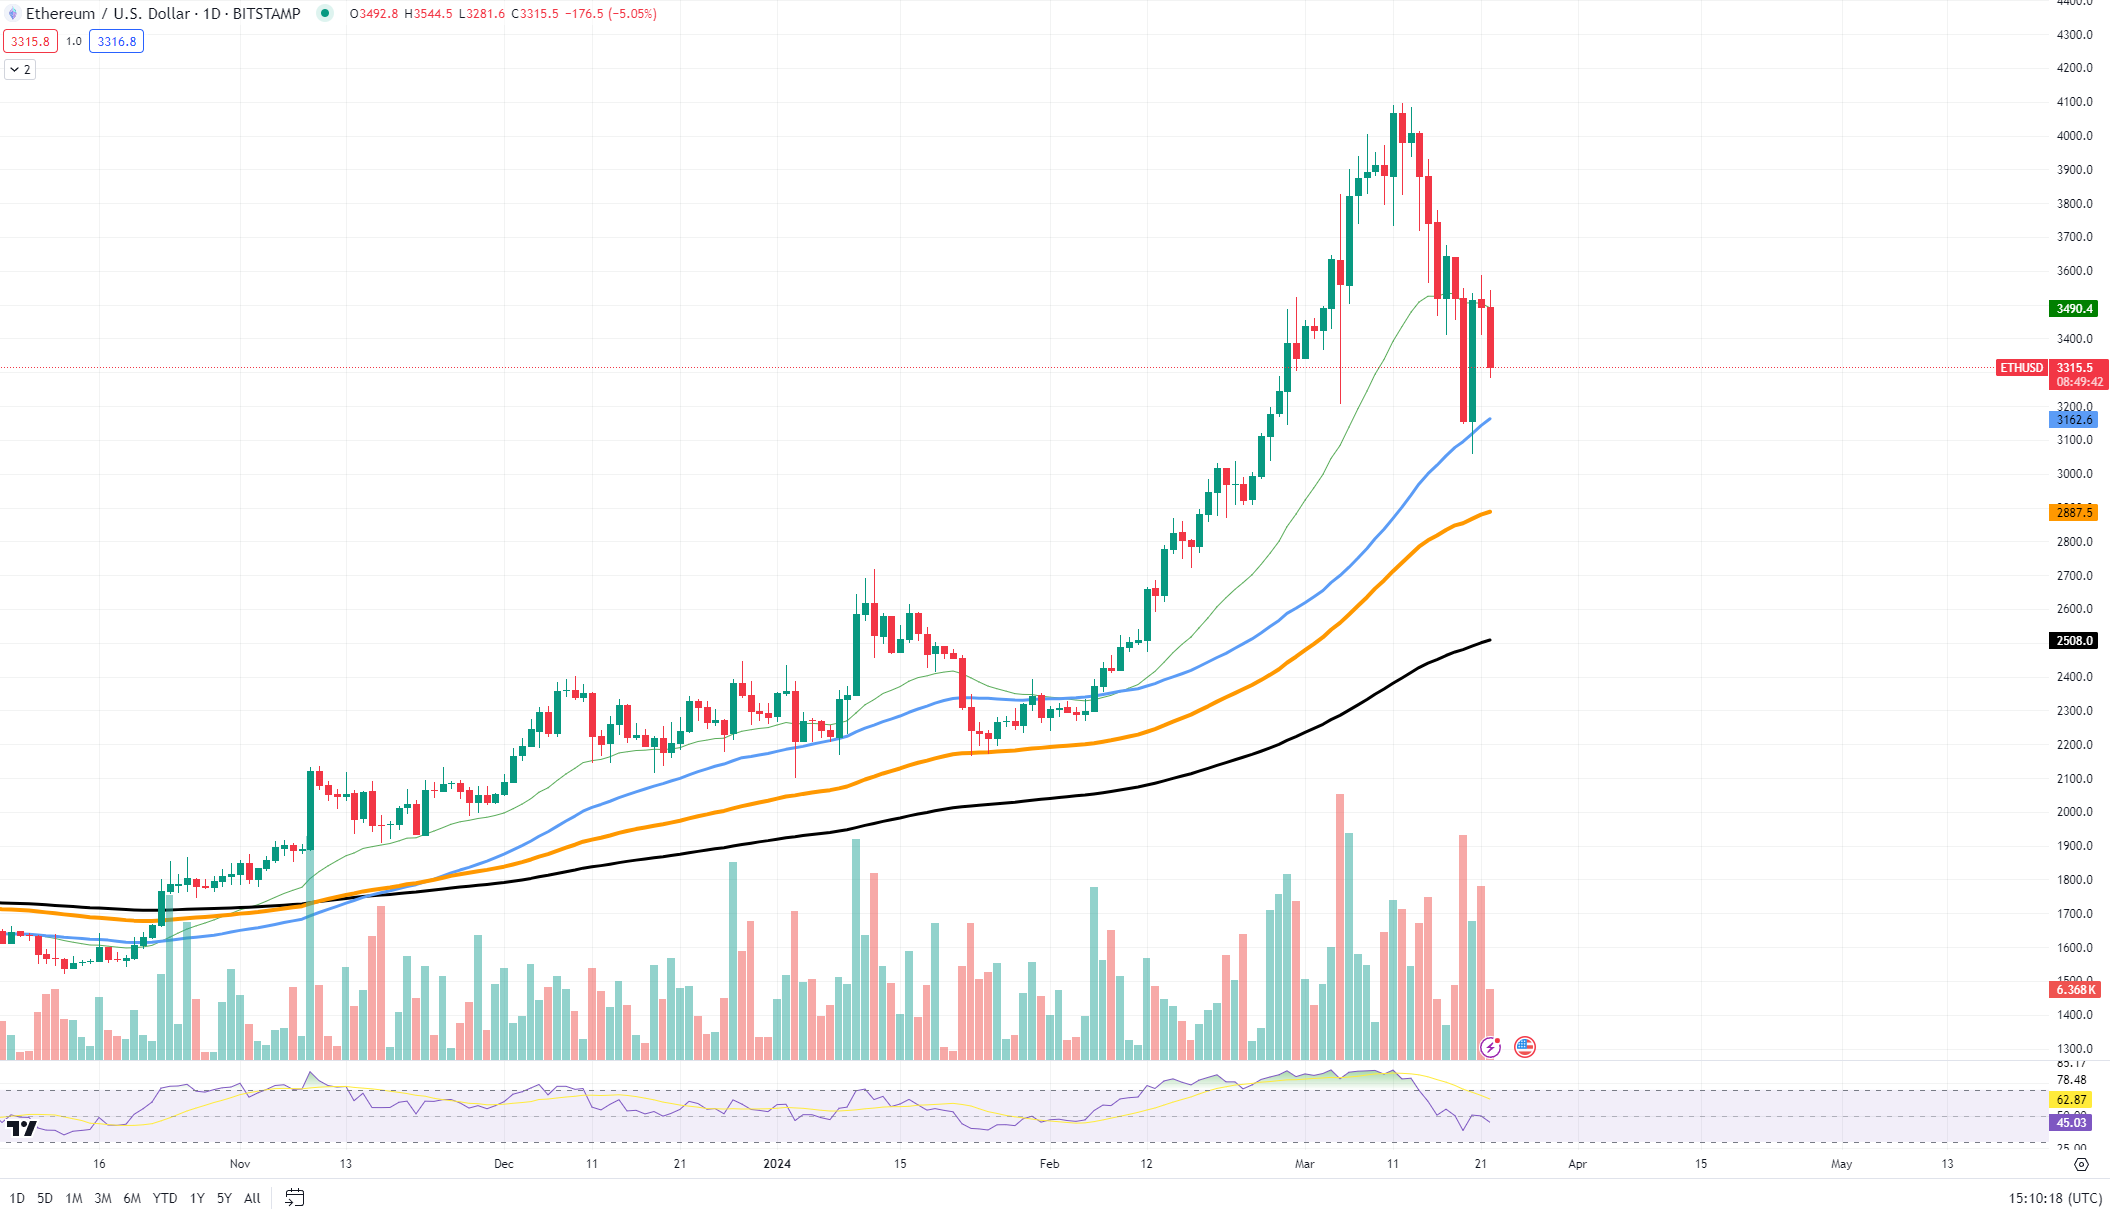
On the other hand, the price of Ethereum has not dropped drastically either. It is above the support level of $3,317, which is essential to keep recovery hopes alive.
If ETH remains stable and recovers from the current support level, there could be another opportunity to break through the resistance. The next target in case of a breakout would be near the $3,900 zone. On the other hand, if the support fails, we could see the price fall towards the next support at around $2,869.
Despite the current pause, Ethereum’s recovery has not failed; It is simply in a state of consolidation; we could soon expect an increase in volatility and a corresponding move.
Cardano in good condition
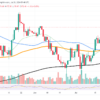
Cardano has almost reached a substantial support level, which could be the “adamantium” ground (a point so strong that the price has a hard time going below it) that needs to recover. ADA price is approaching the $0.54 mark, the level to pay attention to for now.
After a peak near $0.69, ADA has been falling. But it is approaching a price where, in the past, we have seen the trend reverse from falling to rising. This is what some traders might call the “adamantium” level.
If ADA remains above this support and begins to rise, we could be looking at a potential growth scenario. The first objective would be to address the immediate resistance level around $0.60. Overcoming this could put ADA in a better position for growth, perhaps even reaching higher levels like $0.67.
Solana’s hidden potential
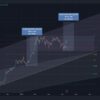
The charts give us a clue as to where it might be headed next. There is a pattern where SOL does not make new highs or lows; It’s a kind of lateral movement. This could mean that you are preparing to continue the trend you already had.
Right now, SOL is trading around $169.27. Not long ago it had shot above $200, but it couldn’t stay there. Now, if you are looking for where SOL could find a floor to bounce from, keep an eye on the $129.35 mark. That’s been a place in the past where the price hasn’t come down much. It’s like a strong line of defense.
As for growth, if SOL can catch the wind and start rising, the first big test will be to break above the $200 level again. That’s where he had problems before. If it can go beyond that, it could trigger another rally.
But what’s next for SOL? If it stays above the support level and the market feels good, we could see it try to rise again. However, if it falls below that $129.35 level, it may have to find a new bottom before trying again.
So what is the hidden signal in SOL price chart? It’s this: the trend could continue. Since SOL is not making any big jumps or falls, it is likely that it will continue on the path it has been on. That means more lateral movement until it breaks or goes down.