Bitcoin has recently faced significant resistance at the $70,000 mark, a psychological threshold that has proven to be a formidable barrier for the digital asset. Despite the excitement surrounding its previous rallies, Bitcoin is currently showing signs of a correction, which could impede its ability to make a quick advance above this level.
Bitcoin has recently faced significant resistance at the $70,000 mark, a psychological threshold that has proven to be a formidable barrier for the digital asset. Despite the excitement surrounding its previous rallies, Bitcoin is currently showing signs of a correction, which could impede its ability to make a quick advance above this level.
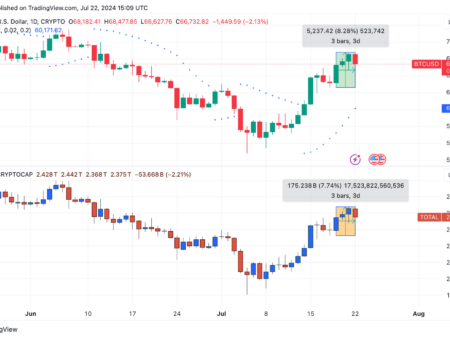
A detailed analysis of the TradingView chart reveals that Bitcoin has found a consolidation phase after a sharp rise. Current local support lies near the $57,932 level, lining up with the 50-day moving average, a crucial technical level that often acts as a bastion for the asset’s price. This area may serve as a base for BTC if bearish pressure increases.
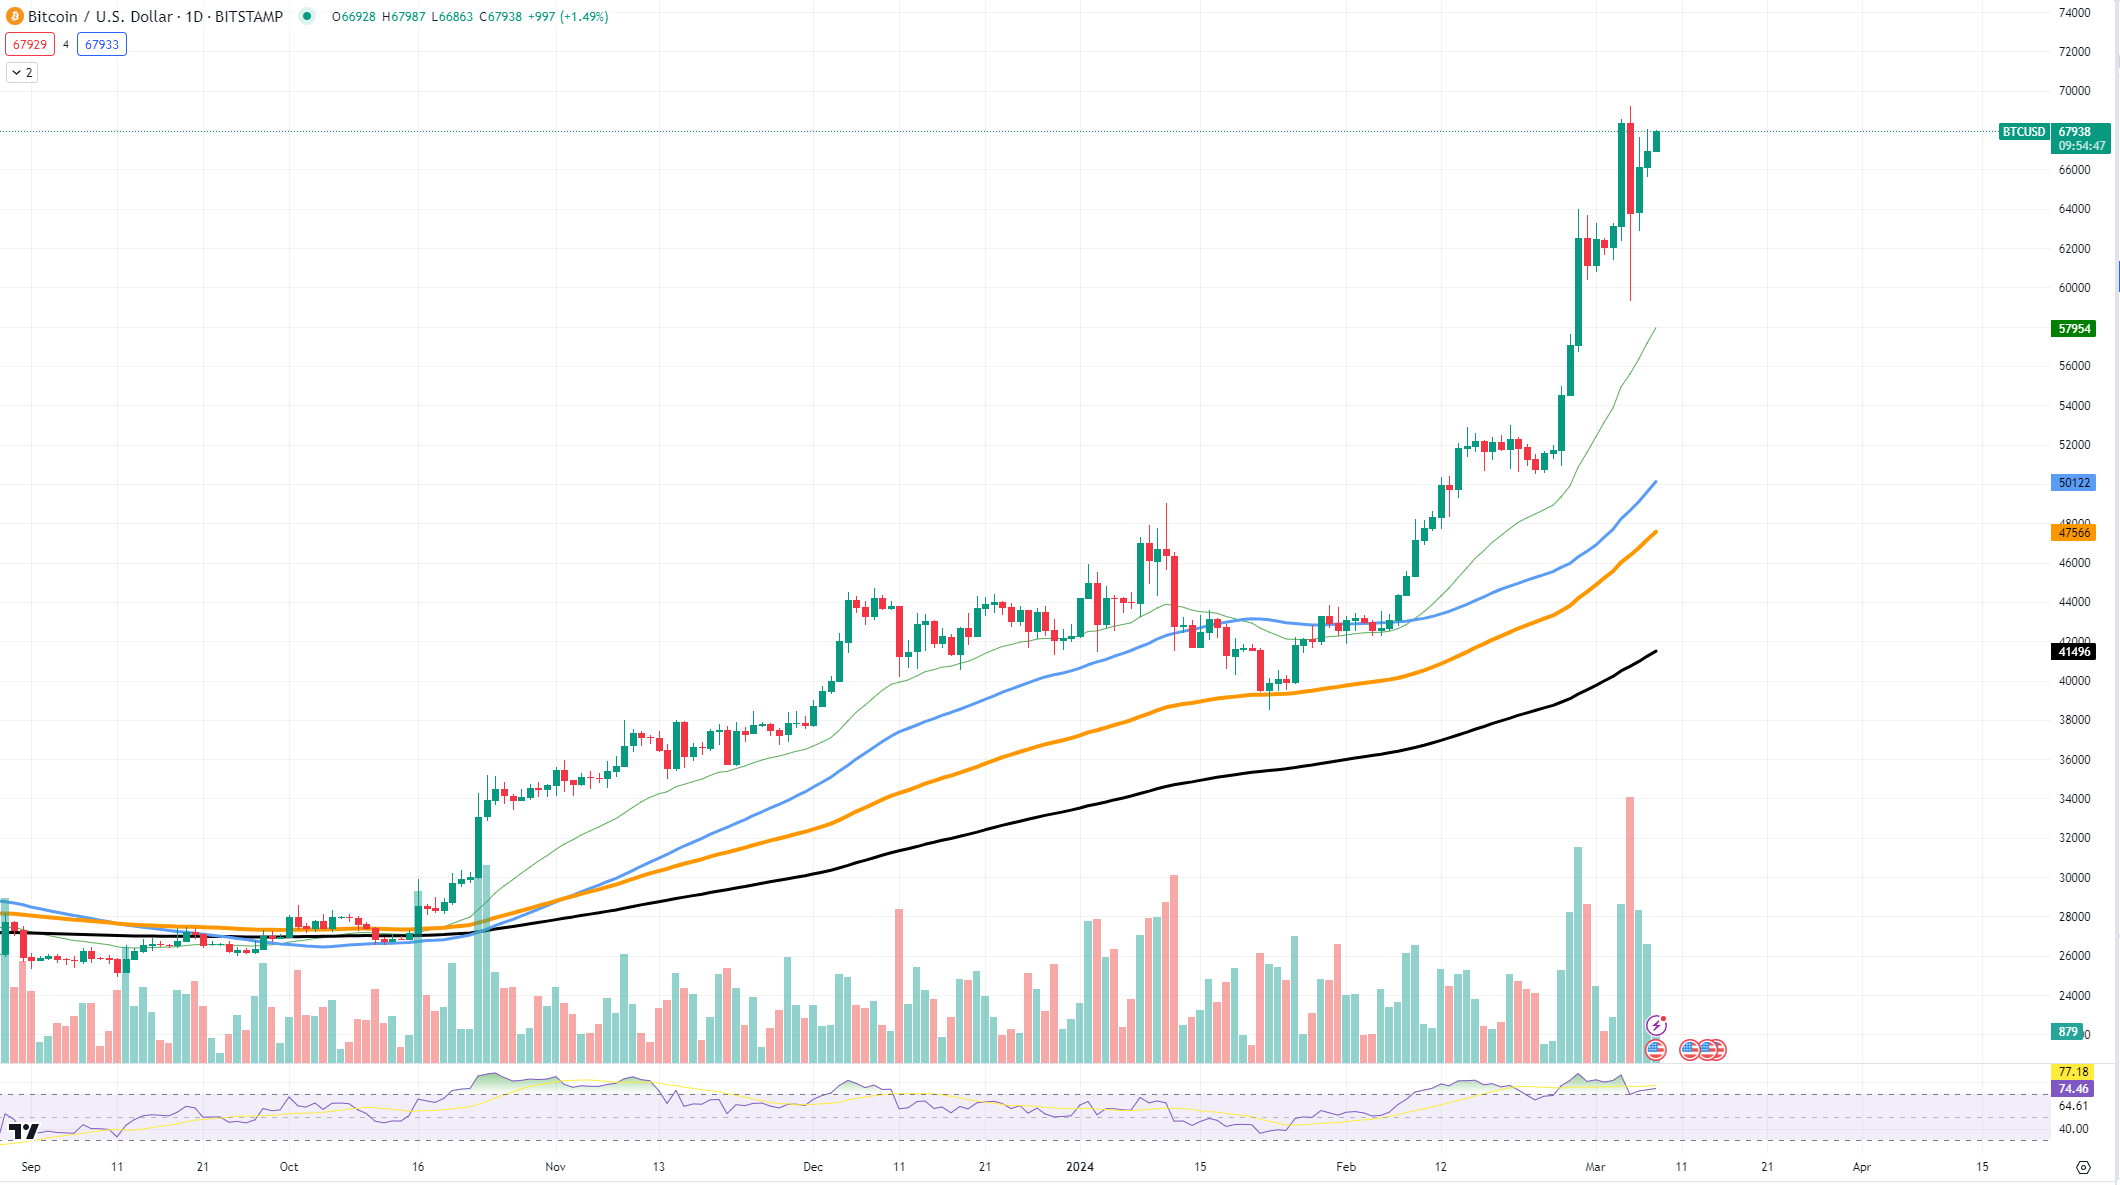
On the contrary, resistance is firmly established at the $70,000 level. This is not just a numerical limit but a psychological one, where sell orders tend to cluster as investors seek to capitalize on round number milestones.
If the correction deepens, Bitcoin may seek support at lower levels, with the next substantial support zone around the $50,117 mark, which is also near the 100-day moving average.
Market sentiment is mixed, reflecting uncertainty over Bitcoin’s immediate path. While long-term confidence in Bitcoin remains high due to its established track record and increasing mainstream adoption, the short-term outlook is clouded by current market conditions and the $70,000 resistance level.
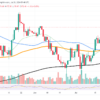
Solana gets up
As the cryptocurrency market continues its dynamic course, Solana (SOL) emerges as a solid contender, preparing to potentially set a new yearly high. As investors and traders watch the SOL chart for signs of its next big move, the digital asset does not disappoint and shows strong bullish signs in its recent price action.
The SOL/USDT pair, as seen on the TradingView chart, is currently experiencing a commendable uptrend. Local support is firmly established around the $120.13 mark, a level that SOL has tested and bounced off of recently, reaffirming its role as a reliable foothold for the asset. The next critical support lies near the $110 region, lining up with the 50-day moving average, and serves as a secondary defense in case any bearish reversal occurs.
On the resistance spectrum, SOL faces its immediate challenge near the $155 zone. A convincing break above this level could very well push Solana to new highs for the year, fueling bullish sentiment across the market. The current price structure, characterized by successive higher highs and higher lows, underlines the possibility of such a breakout.
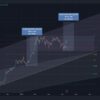
XRP faces a hurdle
XRP is currently facing a major technical challenge on the charts as a worrying pattern emerges that could indicate potential headwinds for the cryptocurrency.
The recent price action of XRP/USDT indicates a struggle to maintain its bullish momentum. After reaching a peak, the asset has started setting lower and lower highs, a technical pattern that can curb bullish sentiment and lead to a trend reversal. This development is critical because lower highs are often associated with decreasing buying pressure and the beginning of a recession.
Current technical analysis places local support for XRP at the $0.55 mark, which is close to the 50-day moving average, a critical juncture for the asset to hold and avoid a bearish outlook. If XRP falls below this support level, the door could open for further declines, with the next substantial support level near $0.50, a psychological and technical support level.
On the contrary, resistance levels have formed near the recent high around $0.63, where XRP has faced rejection, reinforcing the bearish pattern of lower highs. For XRP to negate this worrying trend, it would need to overcome this resistance with conviction and sustained volume, a move that would require significant market acceptance.
Forming lower highs is a worrying sign for XRP, often indicating that sellers are becoming more aggressive and buyers are unable to drive the price to new highs.