The XRP token recently experienced a sharp drop that caught the attention of both investors and traders. After a period of substantial gains, XRP has undergone a correction, sparking speculation about its next move.
The XRP token recently experienced a sharp drop that caught the attention of both investors and traders. After a period of substantial gains, XRP has undergone a correction, sparking speculation about its next move.
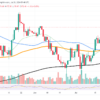
The XRP chart technical analysis indicates that the asset has seen a significant sell-off and the price has fallen precipitously in a short period. This sharp drop has led XRP to test key support levels that could determine the short-term trajectory of the asset.
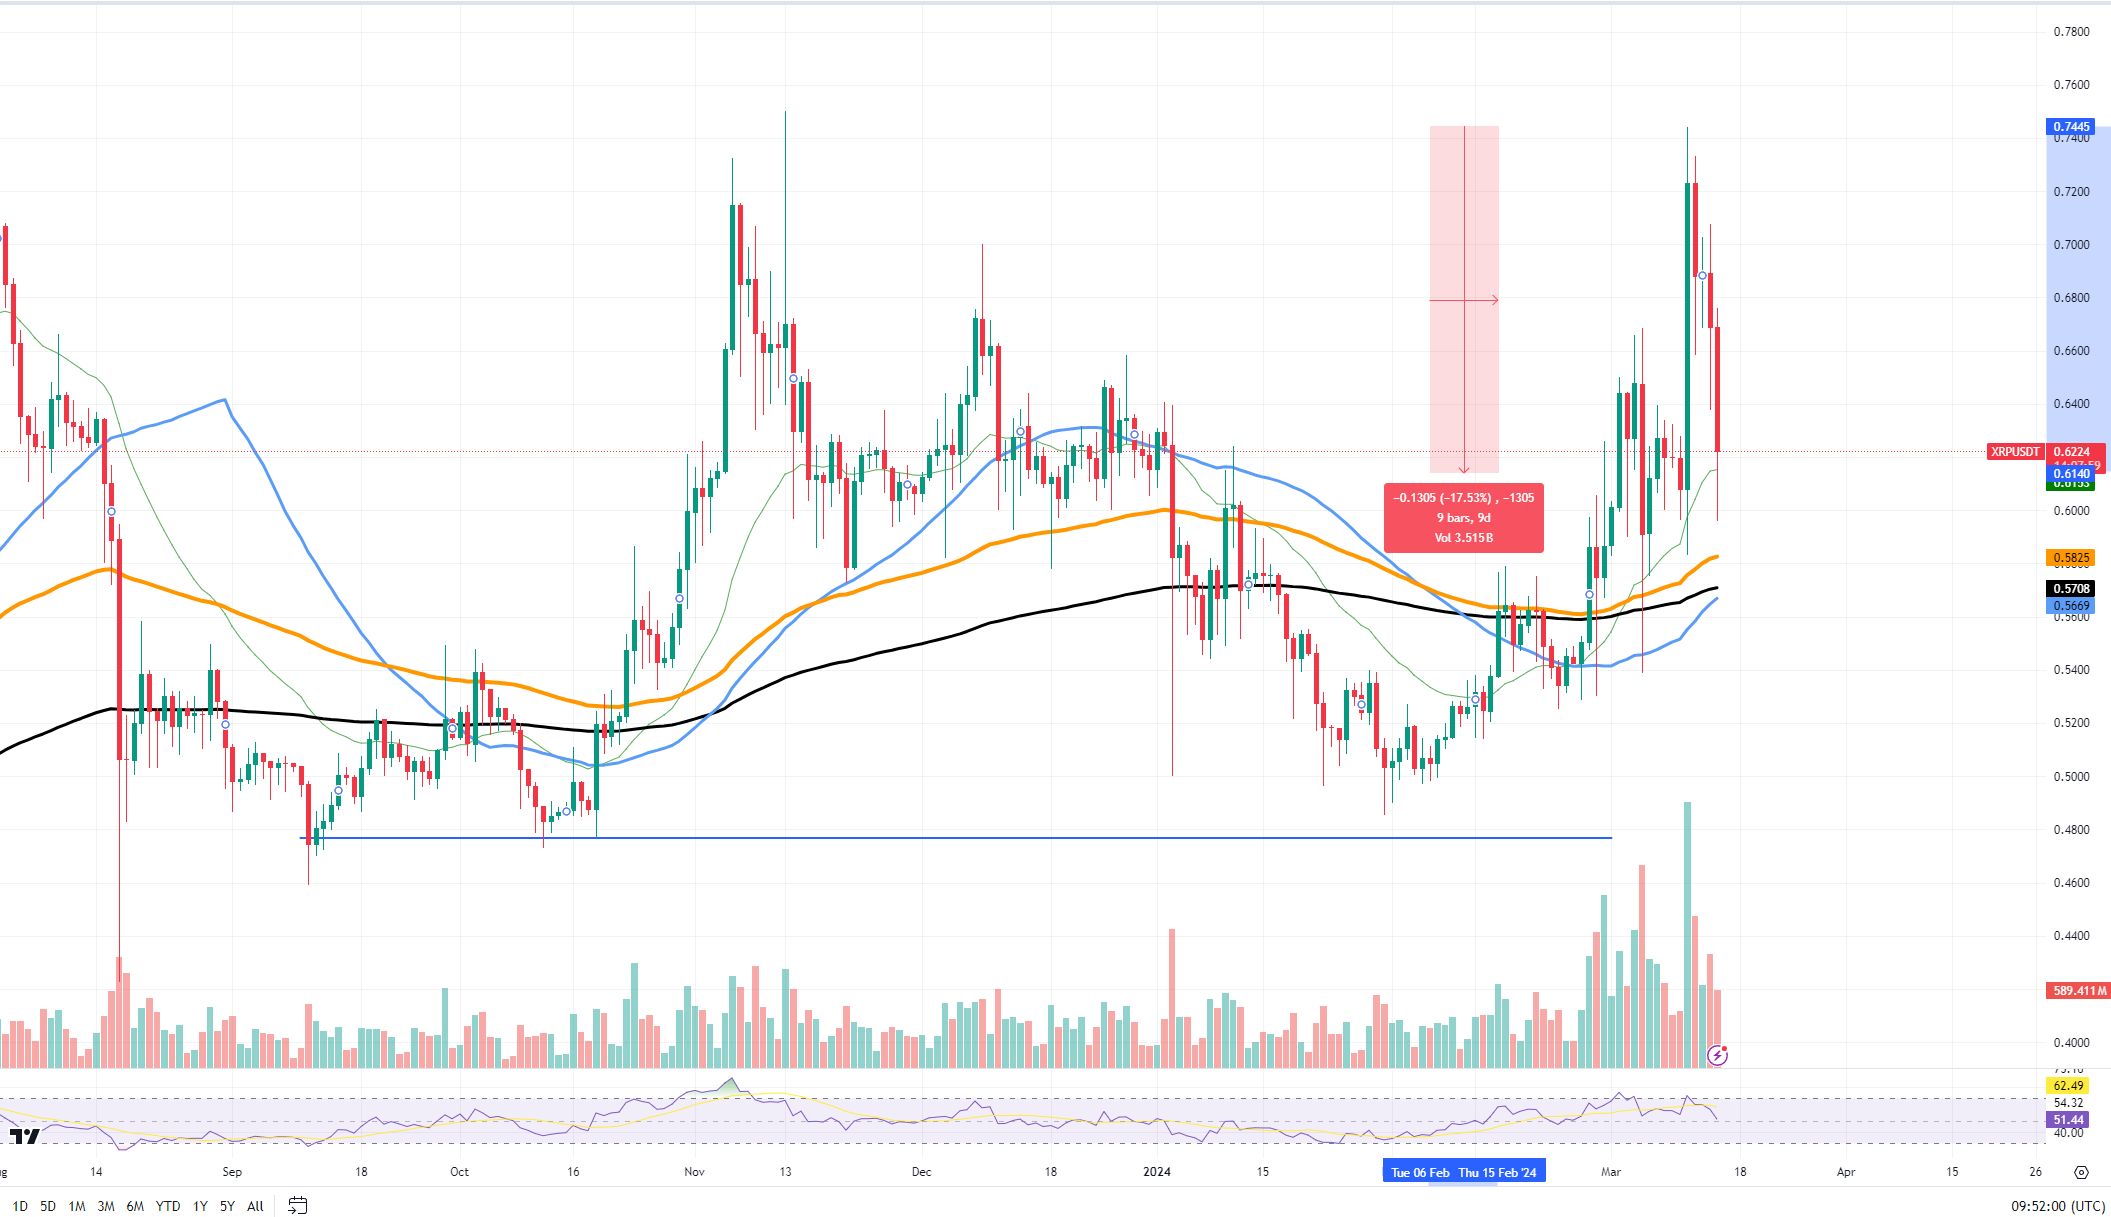
A critical local support level for XRP currently lies around $0.58, a point that aligns with the 100-day moving average. This moving average has traditionally acted as a solid support level, and a bounce off this line could indicate a possible recovery or consolidation phase. If this support holds, it could provide a foundation for XRP price to stabilize and potentially mount a comeback.
Conversely, resistance levels have formed at higher price points, particularly around $0.74, where XRP struggled to maintain bullish momentum. This resistance level represents a major barrier that XRP would have to overcome to restart an uptrend.
The volume indicator shows an increase during the sell-off, indicating a strong market reaction and possibly a climax of selling pressure. This could suggest that the market is shedding weak hands and could be approaching an exhaustion point.
Additionally, the RSI has dipped into oversold territory, which traditionally hints at overselling the asset and could portend a possible reversal if market sentiment changes. The RSI is a momentum oscillator that measures the speed and change of price movements, and its current position could indicate that selling momentum is overloaded.