XRP, the seventh-largest cryptocurrency, may be approaching a critical price juncture with an intriguing pattern suggesting a significant price change could be on the horizon.
XRP, the seventh-largest cryptocurrency, may be approaching a critical price juncture with an intriguing pattern suggesting a significant price change could be on the horizon.
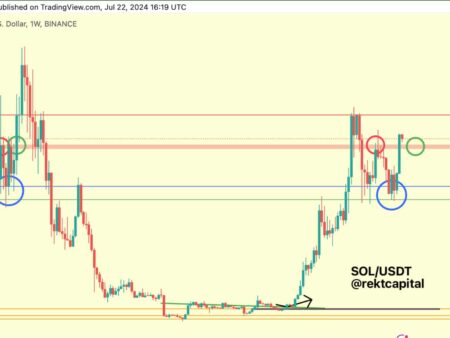
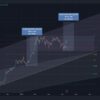
Technical analysts closely follow chart patterns to identify potential trends in asset prices. One such pattern that has emerged on the XRP price chart is the triangle pattern, characterized by converging trend lines that create a triangle shape.
In the context of XRP chartThis pattern suggests a period of consolidation and indecision among traders, with potential for a decisive breakout soon.
The tightening consolidation on the XRP price chart suggests a fight between buyers and sellers, with neither gaining a definitive advantage, so far.
Several factors could serve as catalysts for XRP’s potential breakout of the triangle pattern, including fundamental developments and investor optimism.
Additionally, broader market trends and macroeconomic factors may also influence XRP’s price trajectory, and favorable conditions could fuel a bullish breakout.
A bullish breakout could usher in a new rally for XRP, perhaps resulting in significant gains. However, a failed breakout or bearish reversal could result in losses for those caught on the wrong side of the trade.
If XRP breaks out of the symmetrical triangle, an initial rise could be expected between $1 and $2.5, with a more ambitious long-term target of $20. In the very immediate term, the $0.46 price level has been identified as an important support zone. At the time of writing, XRP was down 1.39% in the last 24 hours to $0.50.
As XRP teeters on the brink of a possible breakout of the triangle pattern, anticipation is building among market participants eager to capitalize on the next major price move; however, the outcome remains uncertain.