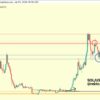
Shiba Inu has failed to break through key resistance levels and is now experiencing downward pressure. This move is characterized by a descending triangle pattern on the charts, indicating possible further declines.
Shiba Inu has failed to break through key resistance levels and is now experiencing downward pressure. This move is characterized by a descending triangle pattern on the charts, indicating possible further declines.
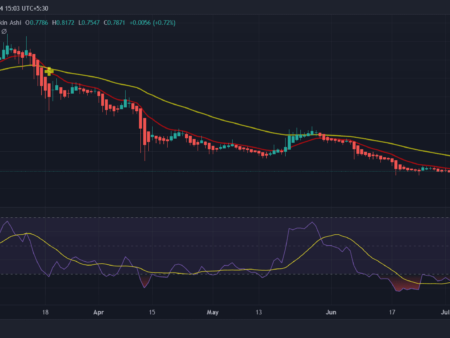
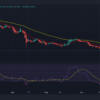
The descending triangle, typically seen as a bearish signal, suggests that sellers are more aggressive than buyers, leading to progressively lower highs. Currently, SHIB faces resistance along the upper trend line of the triangle, while support has been established around $0.0000237. If this support level does not hold, there is a strong possibility that SHIB falls towards the next significant support at $0.000021.
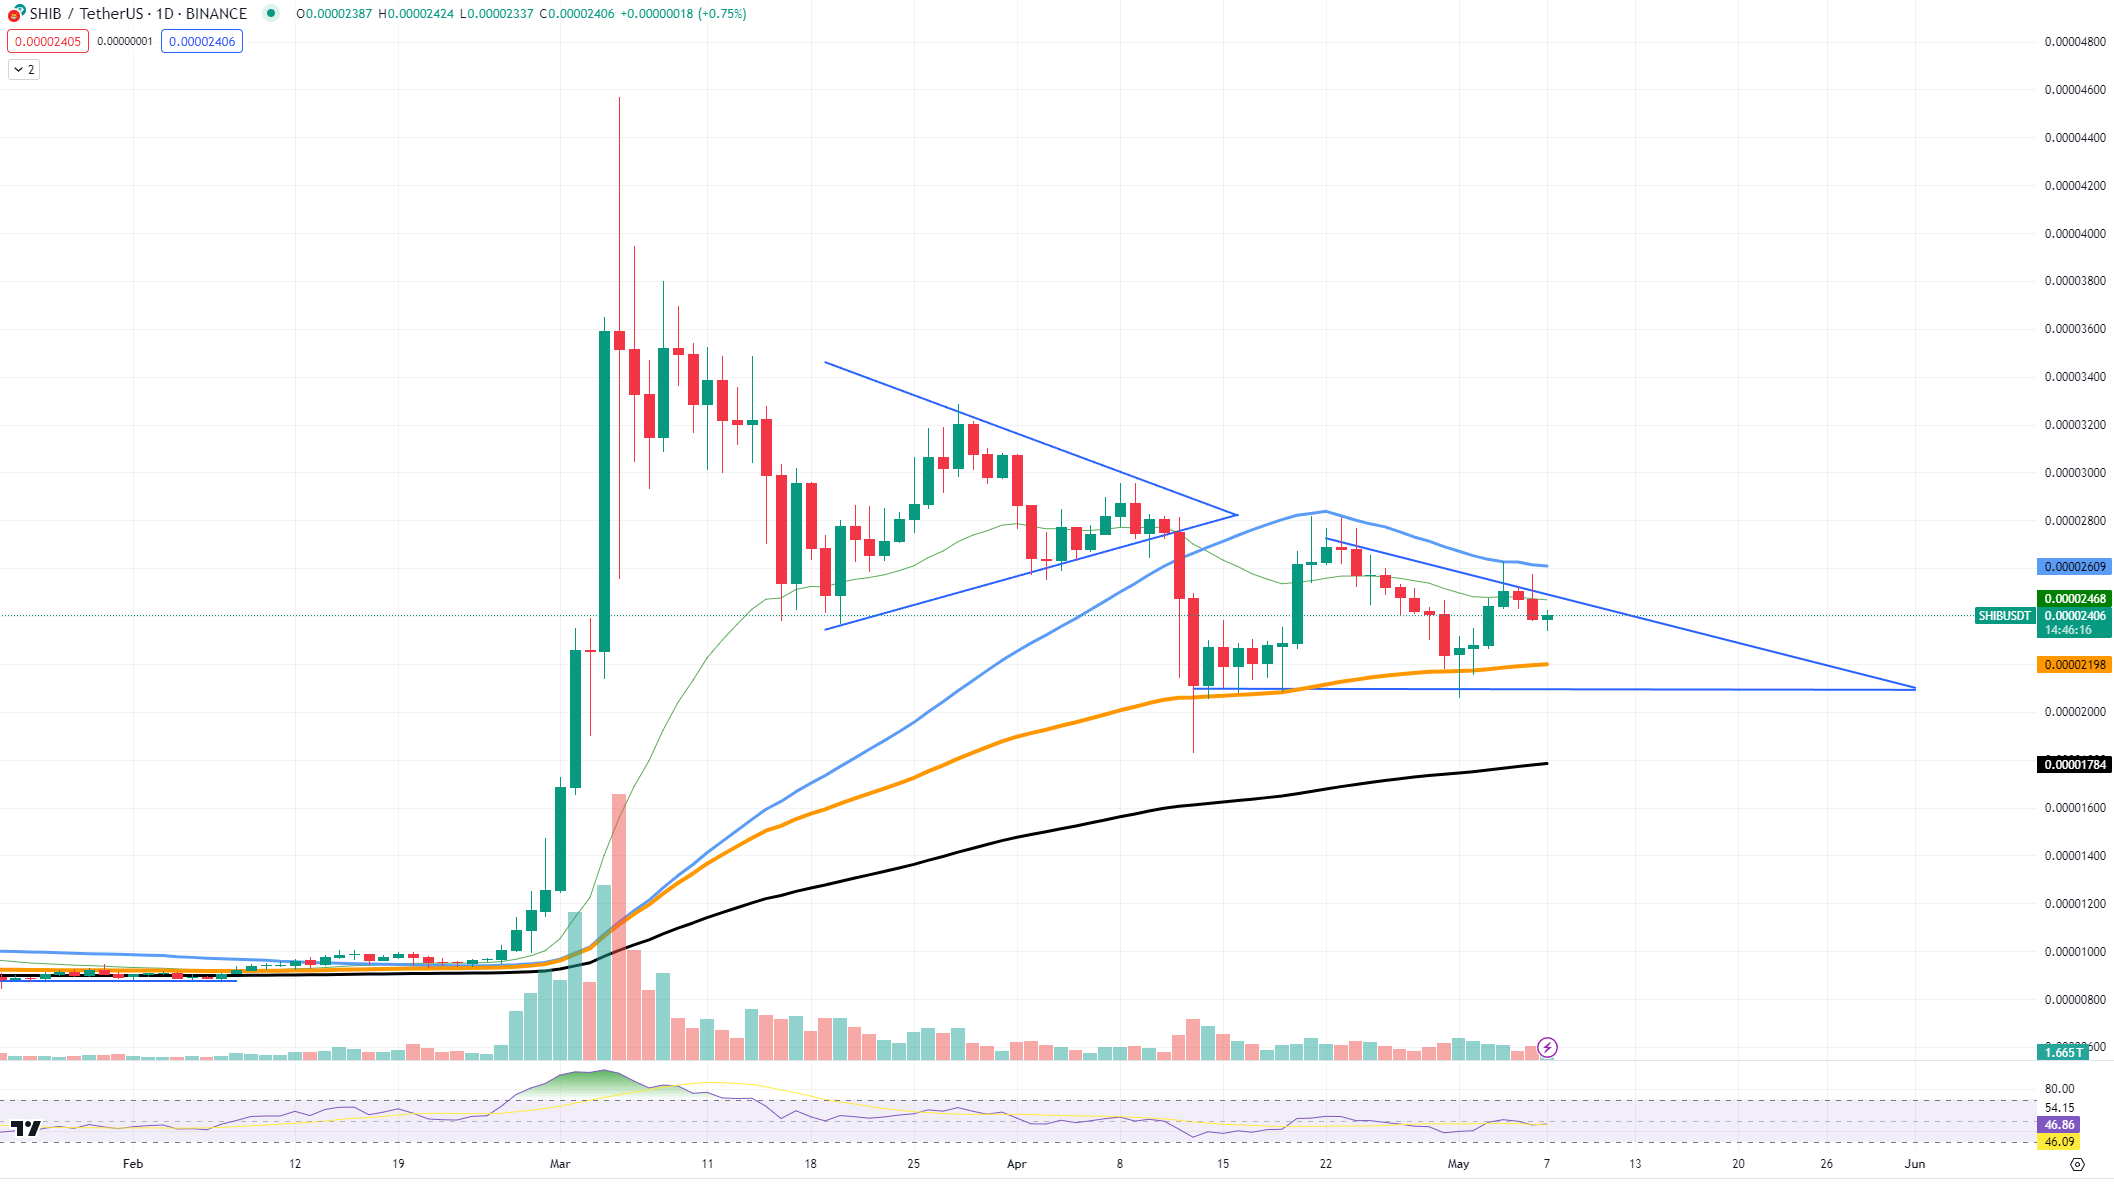
Shiba Inu market sentiment seems to be leaning towards the downtrend. A break below $0.000021 could lead to a test of the $0.00002 mark. The possibility of a break below this level could set the stage for an even larger loss, which would bring some problems to market participants, and specifically to SHIB.
On the other hand, if SHIB can gain enough buying pressure to reverse the current downtrend, it might be possible to return to higher resistance levels, such as $0.0000268. This would require a significant change in market dynamics, potentially driven by positive developments within the Shiba Inu ecosystem or broader changes in market sentiment.
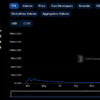
Monitoring the volume right now could be the best way to predict an upcoming Shiba Inu move. Currently, volume trends have been relatively flat, which typically suggests a lack of conviction in the direction of the market. An increase in trading volume, especially in the event of a bullish move, would be a positive sign that a stronger rebound could be underway, but only if the broader market is reversing higher, which unfortunately is not the case for now.