Shiba Inu is showing signs of comeback on its price charts. However, investors should temper their enthusiasm as the road ahead still presents significant challenges.
Shiba Inu is showing signs of comeback on its price charts. However, investors should temper their enthusiasm as the road ahead still presents significant challenges.
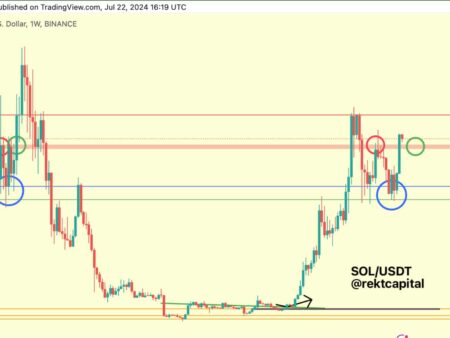
Recently, SHIB managed to break above the 26-day exponential moving average (EMA), a technical indicator used to evaluate short-term price trends. This advance is a positive sign, indicating some buying interest at lower price levels.
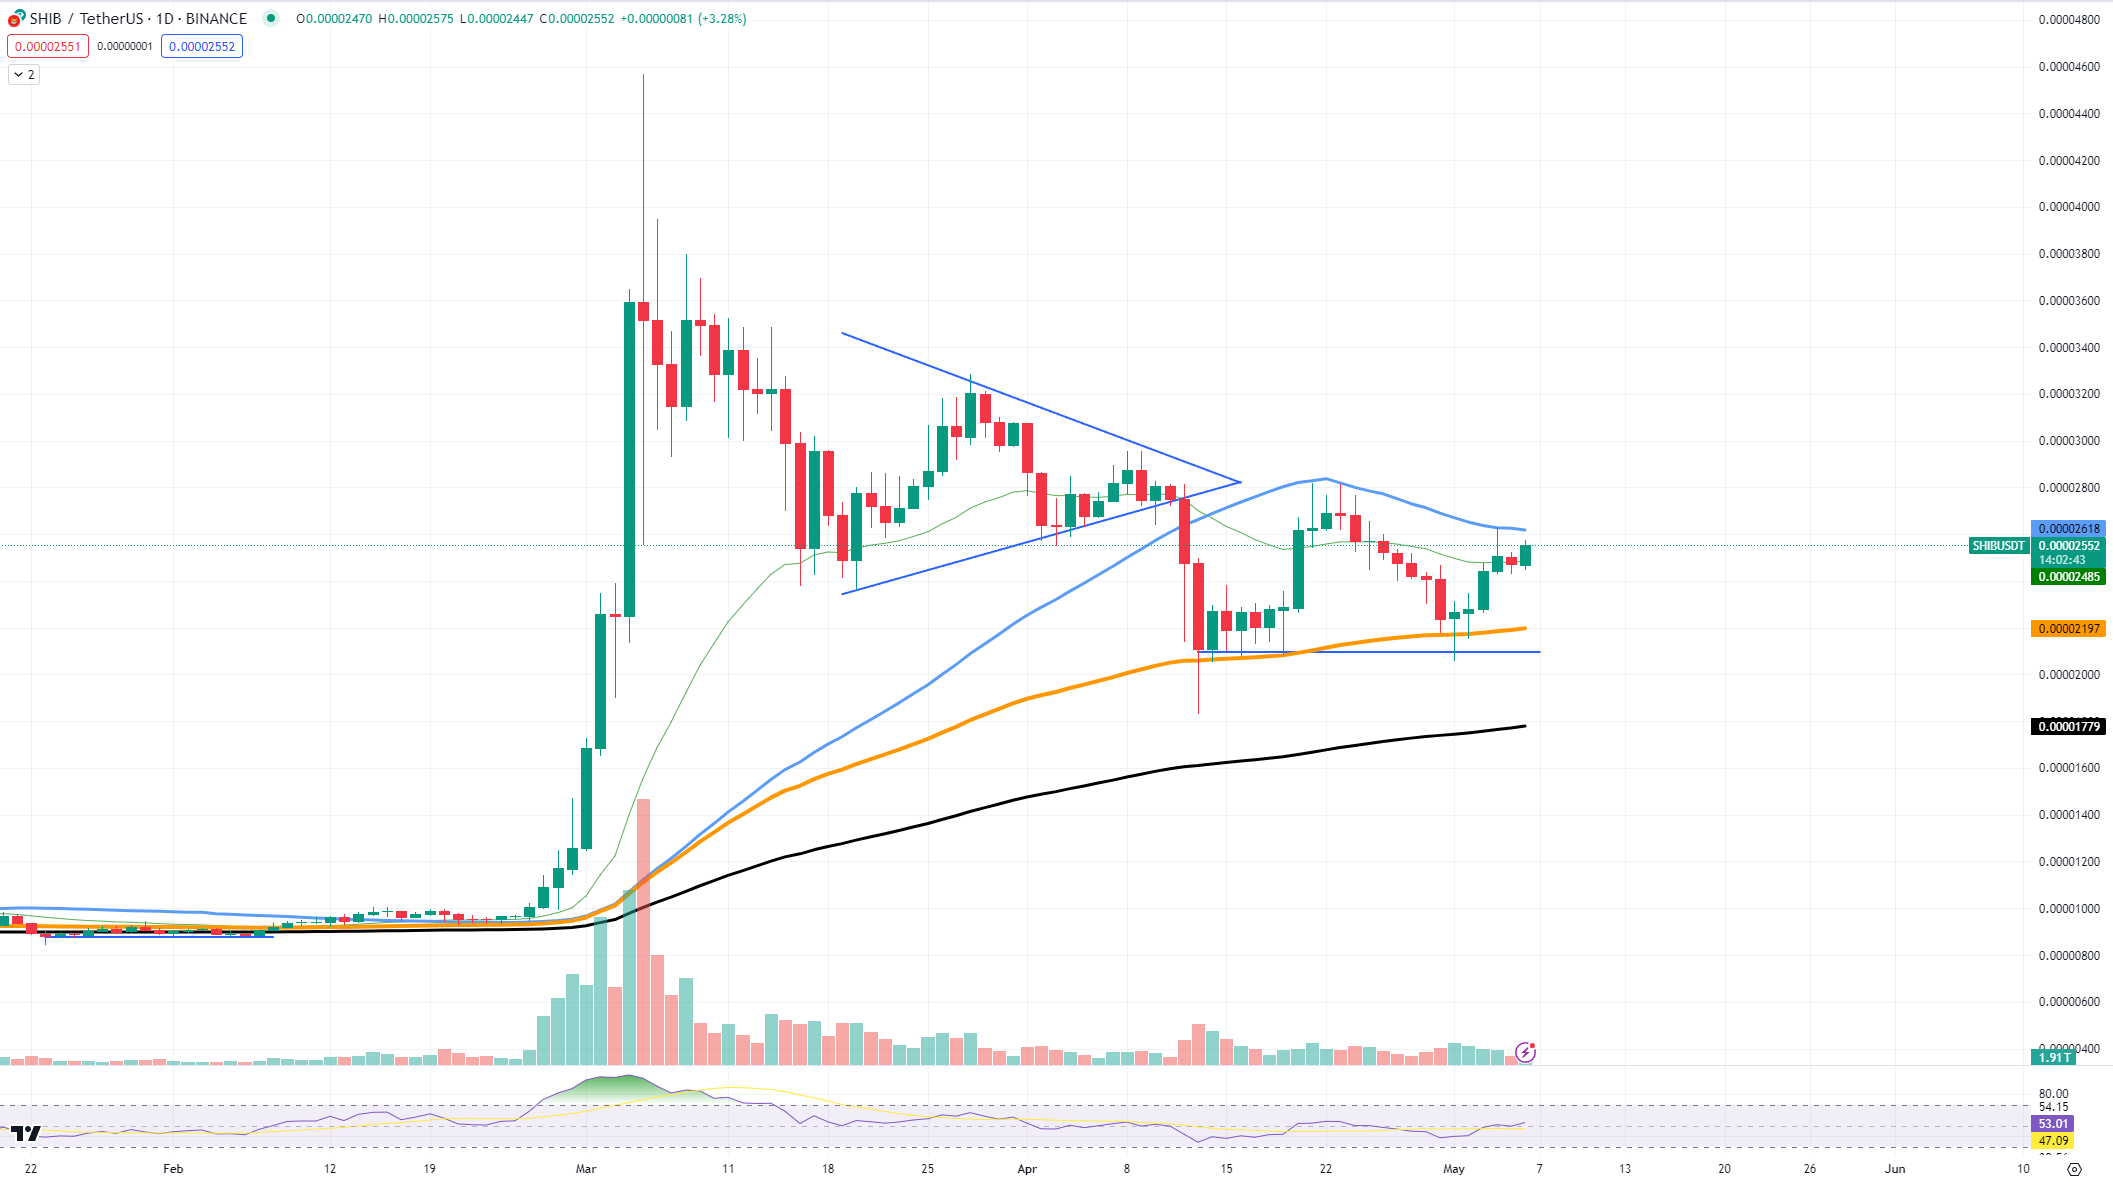
However, the real test is yet to come at the 50-day EMA, which SHIB is currently approaching. This level has acted as strong resistance in the past, and a convincing break above it could signal a stronger turnaround in the market.
If SHIB successfully breaks above the 50-day EMA, the next target could be around the $0.00003 mark. This price is psychological resistance and a prior consolidation area for traders. However, the path to this level is filled with uncertainty, mainly due to the lack of trading volume in the market.
The volume on SHIB’s chart is noticeably low, suggesting a lack of solid conviction behind the recent price movements. Low volume often correlates with low volatility, indicating that the price could remain within a tight range for some time. Furthermore, the relative strength index, which is currently moving towards 60, has not yet confirmed a strong bullish trend.
Key support and resistance levels to watch include the recent low around $0.000021 and the aforementioned 50-day EMA near $0.000025. These levels are likely to pave the way for the asset in the foreseeable future.
While SHIB’s recent progress in breaking the 26-day EMA is restoring hope, it is too early for its holders to start celebrating. The upcoming challenge at the 50-day EMA, coupled with low trading volume, paints a rather gloomy picture for the future of the asset.