Ethereum price began a downward correction below the $3,150 zone. ETH is now consolidating around $3,120 and may attempt to rise again.
- Ethereum began a short-term downside correction below the $3,150 zone.
- The price is trading below $3,200 and the 100-hour simple moving average.
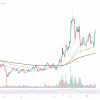
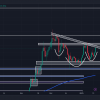
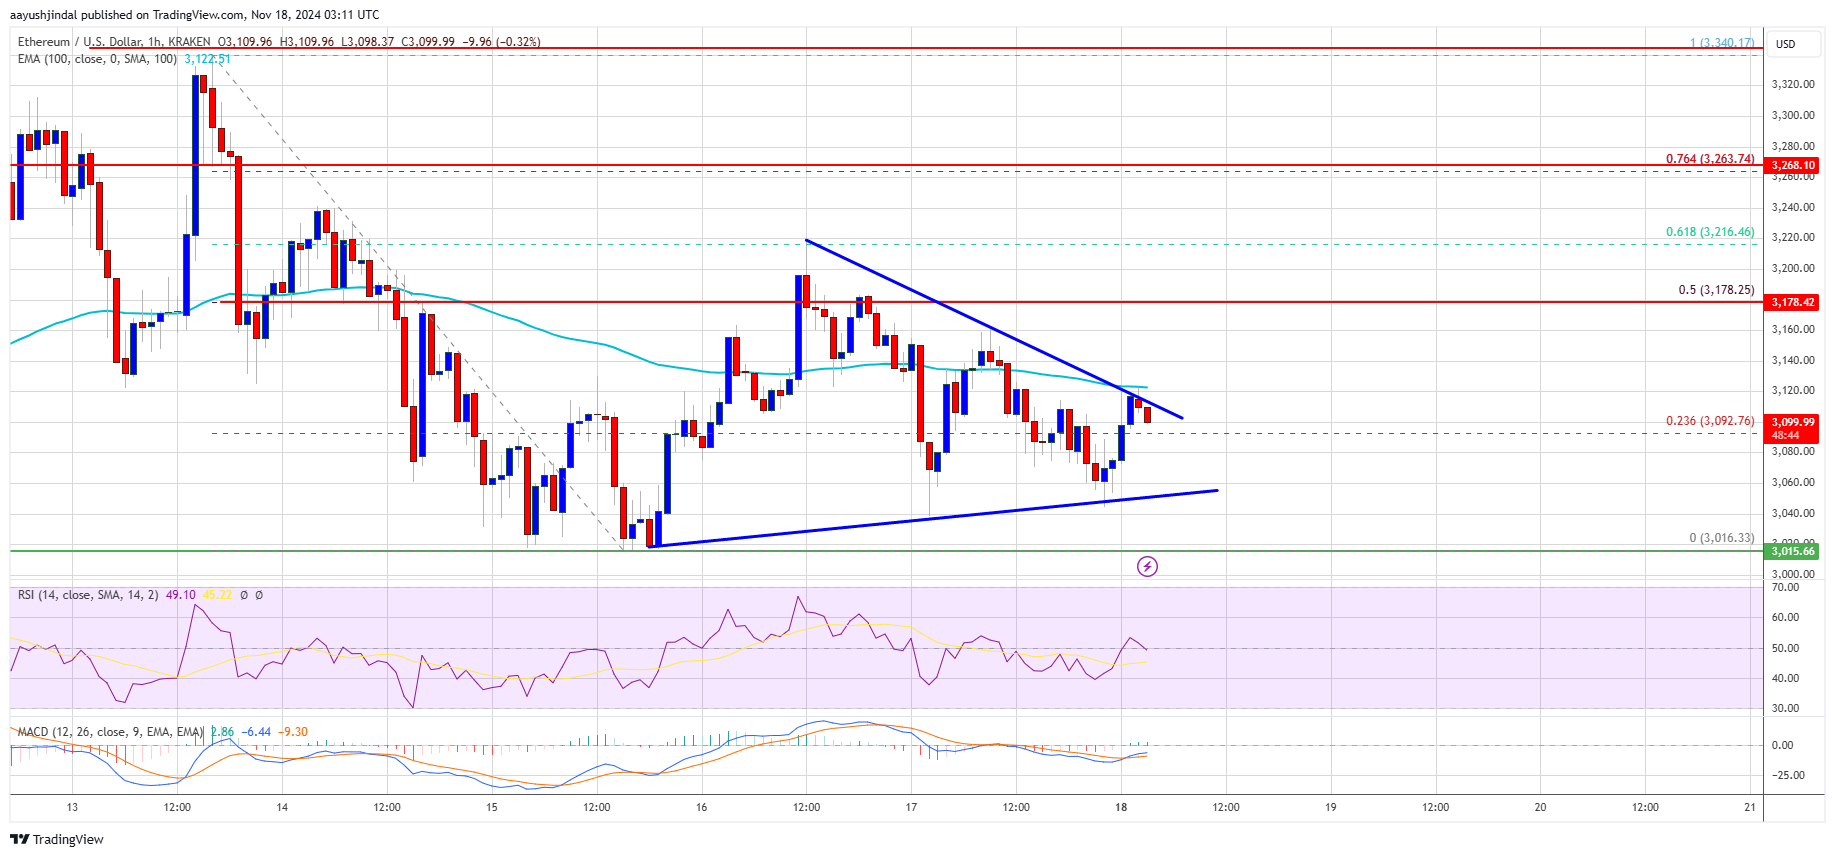
- On the hourly chart of ETH/USD (feed via Kraken), a short-term falling triangle is forming with resistance at $3,120.
- The pair could start a new rise if it remains stable above the $3,040 zone.
Ethereum price rises again
Ethereum price failed to start a new rise above the $3,250 zone and began a downward correction, just like Bitcoin. ETH fell below the $3,150 and $3,120 support levels.
The bears even pushed the price below the $3,040 zone. It tested the $3,000 support zone. The low was formed at $3016, and now the price is consolidating losses. It rose above the 23.6% Fibonacci retracement level of the downward move from the $3,340 swing high to $3,016 low.
Ethereum price is currently trading below $3,200 and the 100-hour simple moving average. On the downside, the price seems to be facing headwinds near the $3,120 level. The hourly chart of ETH/USD is also forming a short-term falling triangle with resistance at $3,120.
The first major resistance is near the $3,180 level or the 50% Fibonacci retracement level of the downward move from the $3,340 swing high to $3,016 low. The main resistance is now forming around $3220.
A clear move above the $3,220 resistance could steer the price towards the $3,320 resistance. A break above the $3,320 resistance could lead to further gains in the coming sessions. In this case, Ether may rise to the resistance zone of $3,450.
Another decline in ETH?
If Ethereum fails to break through the $3,320 resistance, it could start another decline. Initial downside support lies near the $3,060 level. The first major support is near the $3040 zone.
A clear move below the $3,040 support could push the price towards $2,980. Any further losses could push the price towards the $2,920 support level in the near future. The next key support is at $2880.
Technical indicators
Hourly MACD – The MACD for ETH/USD is losing momentum in the bearish zone.
Hourly RSI – The RSI for ETH/USD is currently below the 50 zone.
The main support level is $3,040.
The main resistance level is $3,120.