Following a revival of buying interest and demand, the price of Ethereum has surged, breaking through the 100- and 200-day moving averages.
This price action points to a move towards potential growth, with buyers targeting a new yearly high in the medium term.
Technical analysis
Author: Shayan
Daily chart
A detailed analysis of the Ethereum daily chart shows that after a noticeable increase in buying pressure near the significant support level of $3,000, the cryptocurrency began a bullish surge, surpassing the 100-day ($3,340) and 200-day ($3,152) moving averages.
Additionally, ETH has reclaimed a significant resistance area at $3.5k, which has been a critical barrier for buyers in recent months. This price action indicates a strong buyer presence in the market, targeting a new yearly high.
However, Ethereum has formed a sideways wedge in recent months. It is expected to continue its rise after a short period of market consolidation, aiming to break the upper boundary of the wedge at $3.7k. A successful breakout of this level could lead to a new yearly high above $4k.

4 hour chart
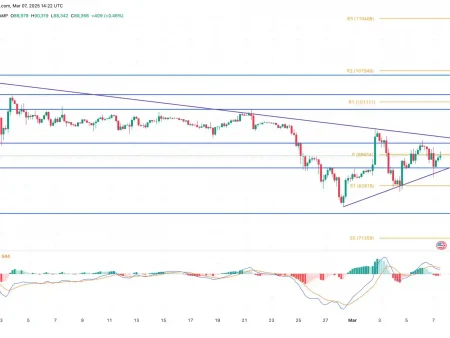
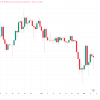
On the 4-hour chart, the strengthening bullish momentum led to an impulsive surge that broke a multi-month downward trendline.
This impulsive move also saw the price return to the significant resistance level of $3.3k, previously filled with supply. This development reflects strong buying interest in the market, targeting higher levels in the long term.
However, Ethereum hit its previous major swing high on the 4-hour timeframe, leading to sideways consolidation.
This swing serves as a reliable resistance level, and a break above it could pave the way for another impulsive push towards the key resistance zone of $3.7k. The ongoing consolidation phase is a positive sign for the market, confirming the recent break above the trend line and completing the pullback to it. If the price breaks its previous central pivot level of $3,524, a continuation of the bullish move will be inevitable.

Sentiment Analysis
Author: Shayan
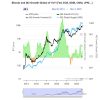
While Ethereum price has experienced a bullish reversal, a closer look is needed to determine whether the bullish trend will continue. The chart highlights the taker bid/ask ratio, an important metric for assessing sentiment in the futures market. Values above 1 indicate aggressive buying by bulls, while values below 1 indicate bearish selling pressure.
As shown in the chart, the taker bid/ask ratio has risen above 1 in tandem with the bullish resurgence in Ethereum price. This spike indicates strong buying interest in the perpetual market, suggesting a strong bullish sentiment. If this upward trend in the taker bid/ask ratio continues, it will confirm a potential medium-term bullish trend in the market, with the price likely to move higher.

