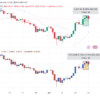
Cardano (ADA) is currently showing signs of bullish potential as it posts a “golden cross” formation on its hourly charts. This development has sparked anticipation among traders and investors, leading to speculation about the possible price trajectory of ADA in the near term.
Cardano (ADA) is currently showing signs of bullish potential as it posts a “golden cross” formation on its hourly charts. This development has sparked anticipation among traders and investors, leading to speculation about the possible price trajectory of ADA in the near term.
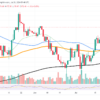
A golden cross occurs when a short-term moving average, typically the 50-hour moving average, crosses above a longer-term moving average, such as the 200-hour moving average, on a price chart. Technical analysts interpret this crossover as a bullish signal, suggesting a possible upward trend in the asset’s price.
In the case of Cardano, the recent bullish crossover on its hourly charts could suggest a change in upward momentum. This bullish formation reflects growing buying pressure and suggests that ADA price could be primed for a significant bullish move in the coming days.
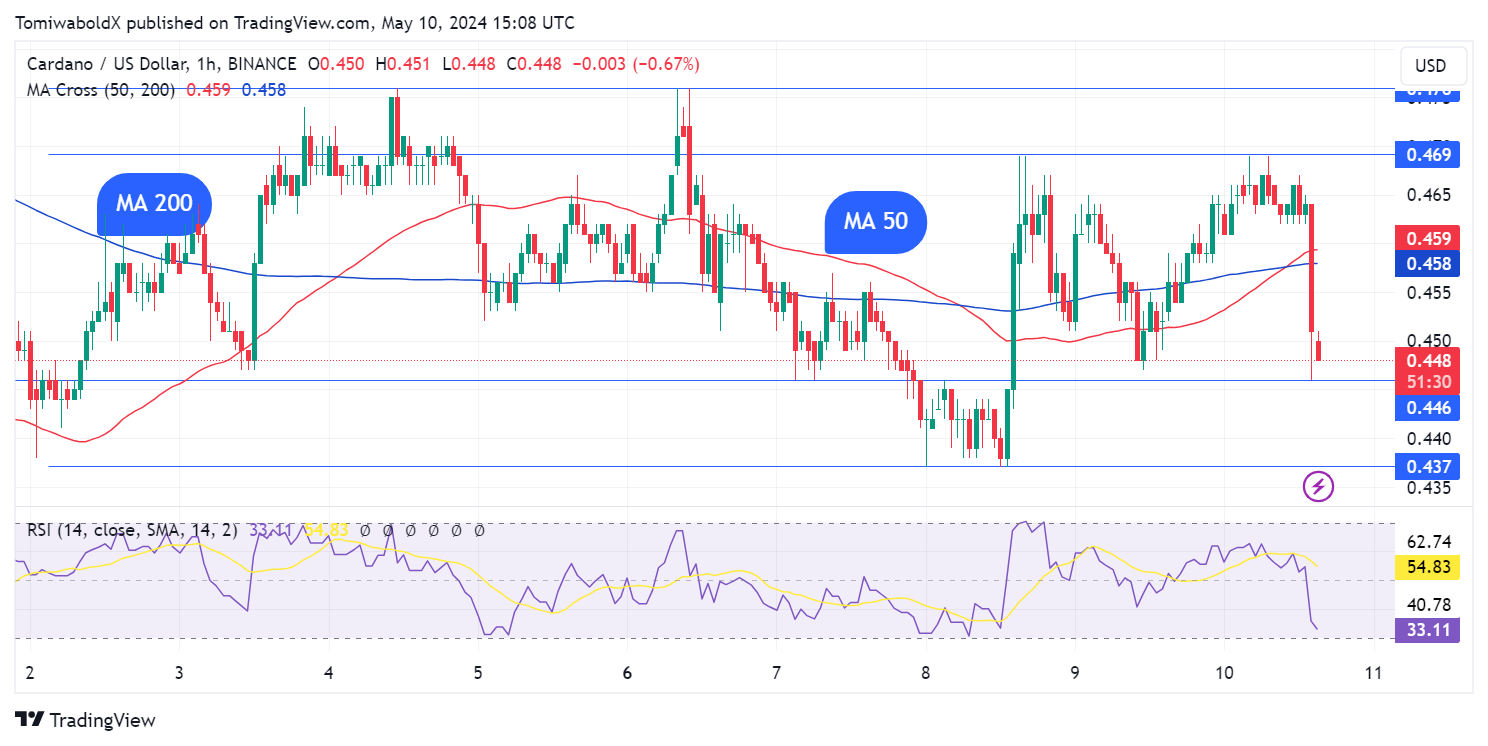
However, it is important to note that while golden crosses can provide valuable information about market sentiment and potential price trends, they are not infallible indicators and should be considered alongside other technical and fundamental factors.
ADA rose 0.59% in the last 24 hours at the time of writing at $0.4575, having reduced its intraday gains. ADA fell sharply on its hourly chart, forming a giant red candle at the time of publication.
Weekly initial jobless claims rose to their highest level since August 2023, shocking financial markets with US inflation data for April due next week.
As the Cardano community eagerly awaits new developments in the market, all eyes are on the charts to see if ADA can capitalize on the bullish golden cross and maintain its bullish momentum. A break above key resistance levels could signal a new bullish phase for ADA, while failure to maintain momentum could lead to selling pressure.
In this sense, a break above $0.684 could start a new uptrend for ADA price; On the other hand, if the selling persists, the $0.4 level can act as a formidable support.
