Bitcoin price consolidates gains near the $90,000 zone. BTC is showing positive signs and could soon reach another rally above $92,000.
- Bitcoin began a fresh rally above the $90,000 zone.
- The price is trading above $90,000 and the 100-hour simple moving average.
- On the hourly chart of the BTC/USD pair, a key bullish trend line is forming with support at $89,600 (data feed from Kraken).
- The pair could gain bullish momentum if it breaks through the $92,600 resistance zone.
Bitcoin Price Targets Another ATH
Bitcoin price began a short-term downward correction below the $90,000 level. BTC traded below the $88,000 level before finding support.
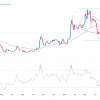
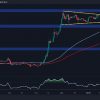
The low was formed at $86,621, and the price is now recovering. There was a move above the $90,000 level. The maximum was formed at $92,607, and now the price is consolidating. It is trading near the 23.6% Fibonacci retracement level of the upside move from the $86,621 swing low to $92,607 high.
Bitcoin price is currently trading above $90,000 and the 100-hour simple moving average. The hourly chart of the BTC/USD pair is also forming a key bullish trendline with support at $89,600. The trendline is close to the 50% Fibonacci retracement level of the upward move from the swing low of $86,621 to the high of $92,607.
On the downside, the price could face resistance near the $92,000 level. The first key resistance is near the $92,500 level. A clear move above the $92,500 resistance could push the price higher. The next key resistance could be $93,200.

A close above the $93,200 resistance could trigger further gains. In this case, the price may rise and test the resistance level of $95,000. Further growth may lead the price to the resistance level of $98,000.
Another BTC drop?
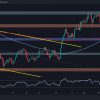
If Bitcoin fails to rise above the $92,000 resistance zone, it could begin a downward correction. The immediate downside support is near the $90,000 level.
The first major support is near the $89,650 level. The next support is now near the $88,000 zone. Any further losses could push the price towards the $86,500 support in the near future.
Technical indicators:
Hourly MACD – The MACD is now losing momentum in the bearish zone.
Hourly RSI (Relative Strength Index) – The RSI for BTC/USD is now above the 50 level.
Major support levels are $89,650, followed by $88,000.
The main resistance levels are $92,000 and $92,500.