XRP (XRP) price fell below its moving average lines after buyers failed to hold it above the $0.64 resistance level.
XRP Long Term Analysis: Bearish
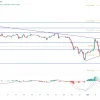
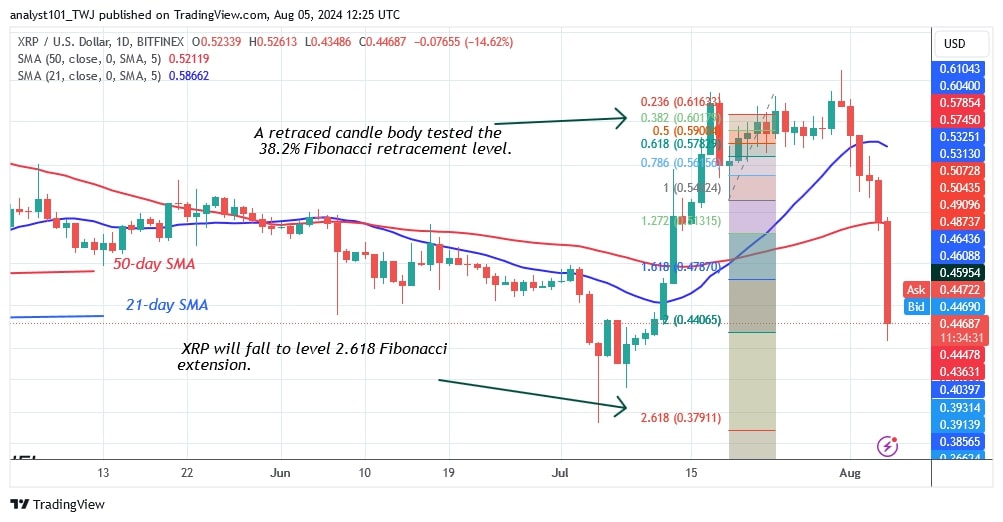
On July 17, the altcoin rose to a high of $0.638 before being rejected. XRP dropped to a low and then began an upward correction. The upward correction was stopped at a high of $0.659, which led to a decline in the cryptocurrency. The altcoin fell to a low of $0.43 and then recovered. Based on price action, the altcoin is likely to return to its low of $0.38.
On July 19, as part of an upward correction, the 38.2% Fibonacci retracement line was tested by the body of the candlestick, which is pulling back, Coinidol.com reports. The pullback implies further decline to the 2.618 Fibonacci extension level or $0.379.
XRP Indicator Analysis
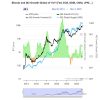
The cryptocurrency price has fallen significantly to the bottom of the chart. The altcoin is approaching its recent low of $0.38.
The price bars are below the moving average lines, indicating that cryptocurrencies will continue to fall. The long tails of the candles point to important support at $0.38. The long candles represent significant buying pressure at the bottom of the chart.
Technical indicators:
Key resistance levels are $0.80 and $1.00
Key support levels are $0.40 and $0.20
What is the future direction of XRP?
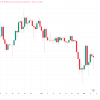
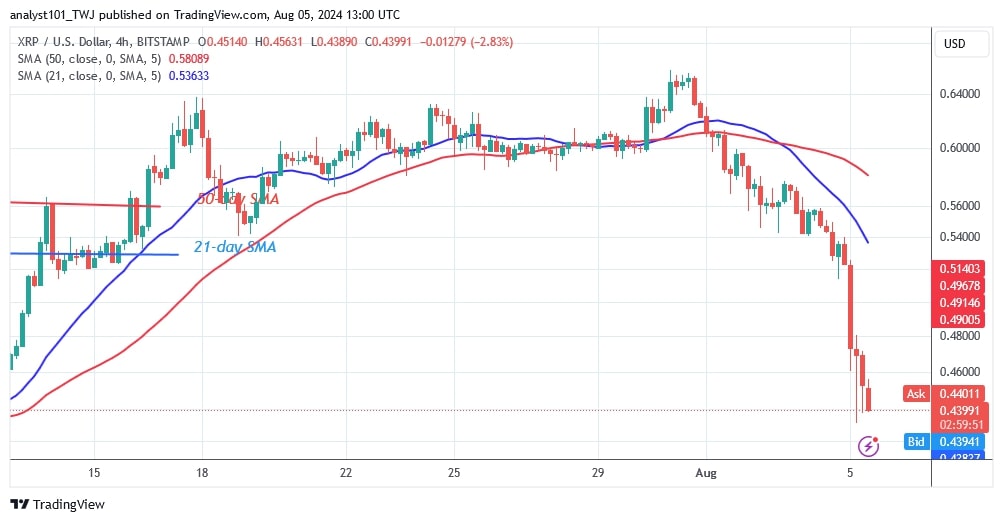
On the 4-hour chart, the cryptocurrency price is hovering above the $0.43 support. The altcoin is correcting upwards and reaches a high of $0.47. XRP is trading above $0.43 and below the moving average lines. The altcoin will fall further if it falls below $0.43.
Disclaimer: This analysis and forecast are the personal opinions of the author. They are not a recommendation to buy or sell cryptocurrency and should not be considered an endorsement by CoinIdol.com. Readers should do their own research before investing in funds.
