XRP price is stuck in a small range below the $0.550 level. The price must break through the resistance levels of $0.5450 and $0.5500 to begin a new rise.
- XRP price is still ranged above the support at $0.5080.
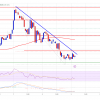
- The price is currently trading around $0.5320 and the 100-hour simple moving average.
- On the hourly chart of the XRP/USD pair, a bearish trend connecting line is forming with resistance at $0.5340 (data source from Kraken).
- The pair could gain bullish momentum if it breaks through the $0.5360 and $0.5450 resistance levels.
XRP Price Sees New Surge
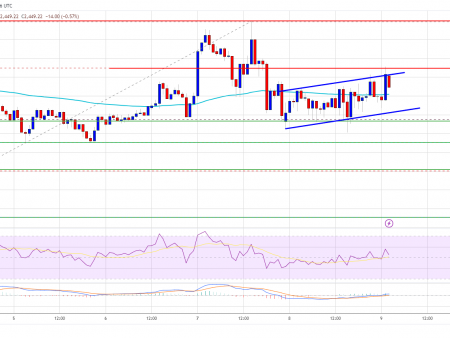
The XRP price remained above the support level at $0.5080. The price began a consolidation phase above the $0.5120 level, in contrast to Bitcoin and Ethereum.
There was a slight rally within the range and the price moved above the resistance at $0.5250. There was a movement above the $0.5320 level. However, bears are active near the 50% Fibonacci retracement level of the downward wave from the $0.5453 swing high to $0.5211 low.
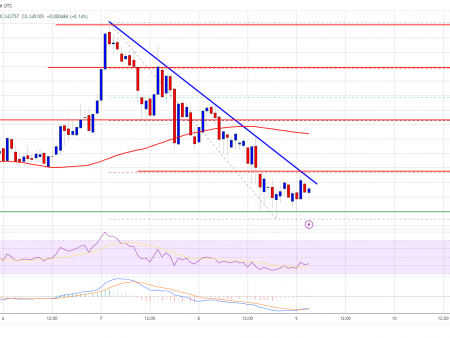
The price is currently trading around $0.5320 and the 100-hour simple moving average. If there is another rise, the price may face resistance near the $0.5340 level. On the hourly chart of the XRP/USD pair, a bearish trend connecting line is also forming with resistance at $0.5340.
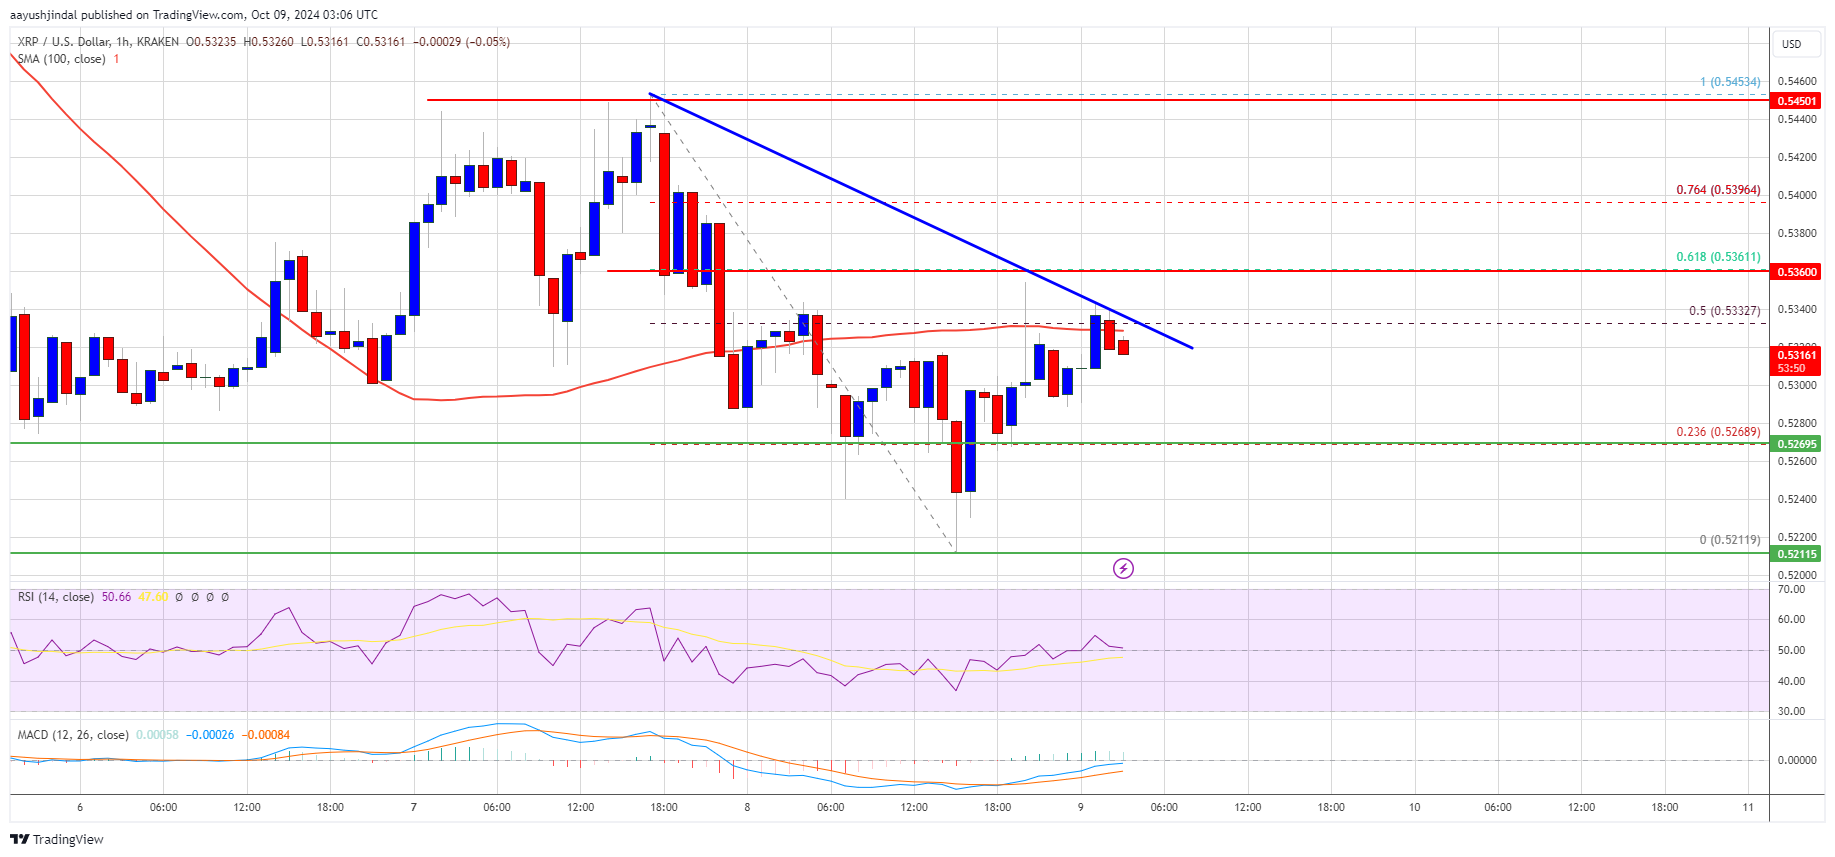
The first major resistance is near the $0.5460 level or the 61.8% Fibonacci retracement level of the downward wave from the $0.5453 swing high to $0.5211 low. The next key resistance could be $0.5550. A clear move above the $0.5550 resistance could send the price towards the $0.5800 resistance. Any further rise could take the price towards the $0.6000 resistance or even $0.6050 in the near future. The next major hurdle could be $0.6250.
Another recession?
If XRP fails to break through the $0.5360 resistance zone, it could begin another decline. Initial support on the decline lies near the $0.5200 level. The next major support is near the $0.5165 level.
If there is a downside breakout and close below $0.5165, the price could continue to decline towards the $0.5050 support in the near term. The next major support is near the $0.5000 zone.
Technical indicators
Hourly MACD. The MACD for XRP/USD is currently gaining momentum in the bullish zone.
Hourly RSI (Relative Strength Index) – The RSI for XRP/USD is now above the 50 level.
The main support levels are $0.5200 and $0.5165.
The main resistance levels are $0.5360 and $0.5450.