XRP price is still trading in a range below the $0.550 level. The price is slowly moving lower and there could be more falls below $0.520.
- XRP price is still ranged above the support at $0.5080.
- The price is currently trading below $0.5300 and the 100-hour simple moving average.
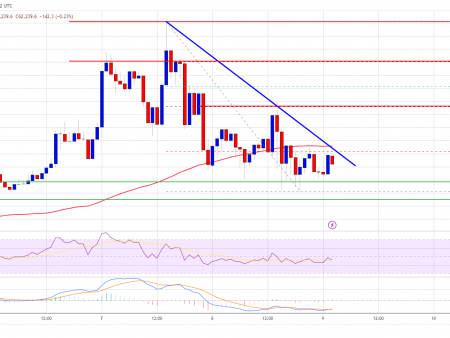
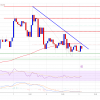
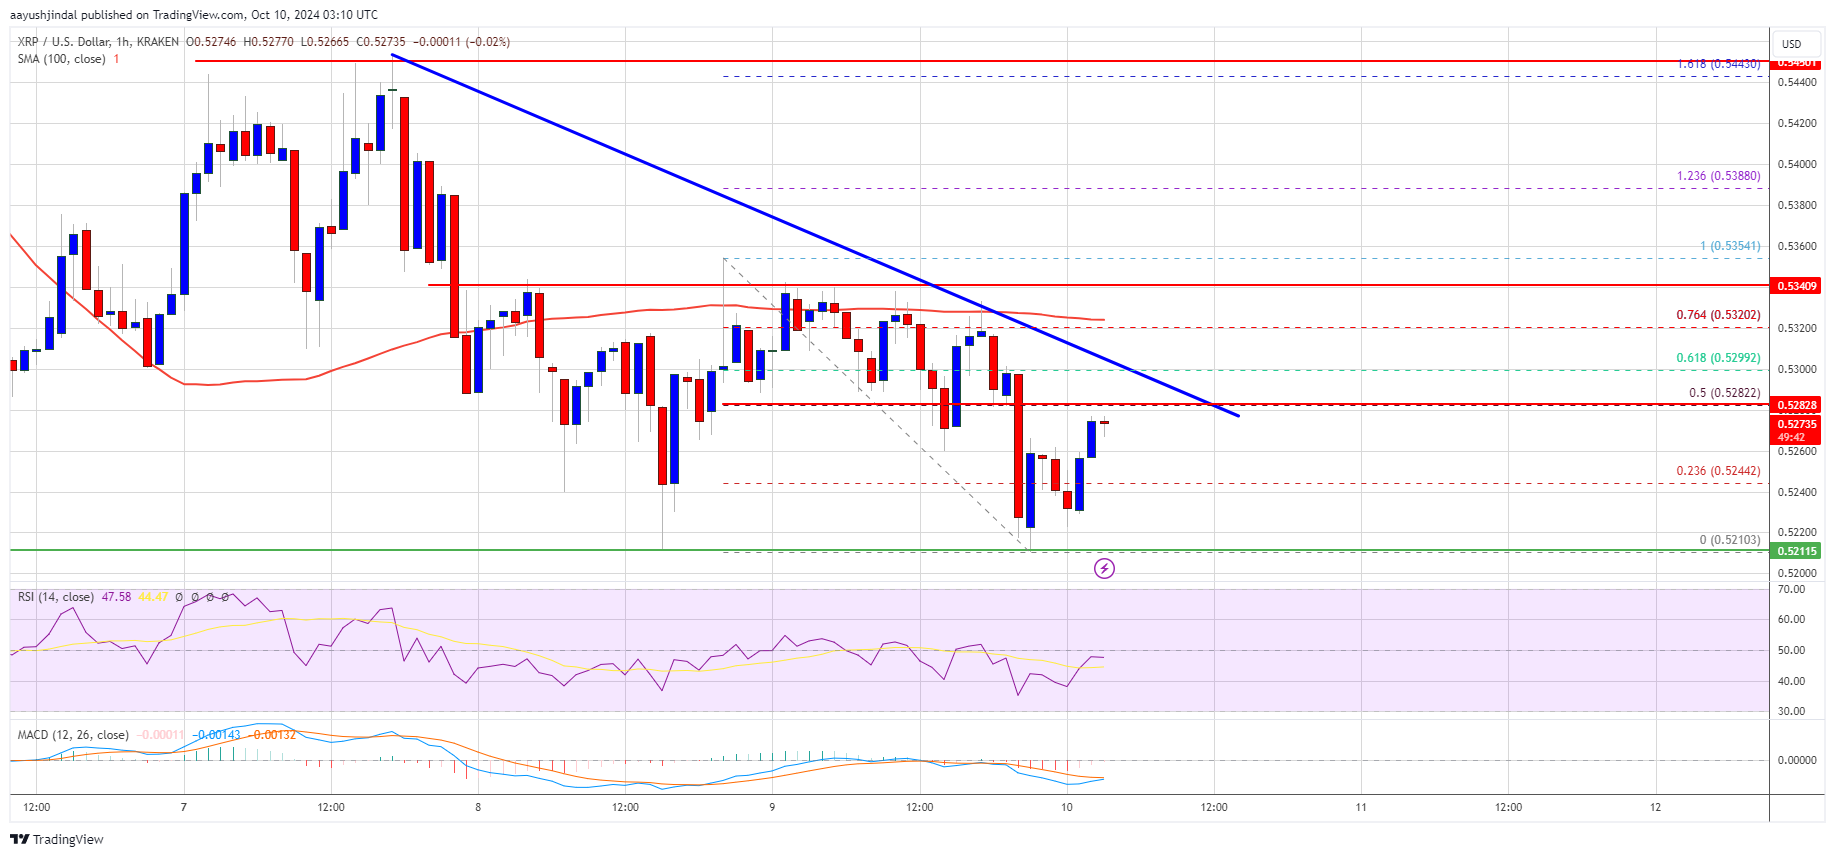
- On the hourly chart of the XRP/USD pair, a bearish trend connecting line is forming with resistance at $0.5285 (data source from Kraken).
- The pair could gain bullish momentum if it breaks through the $0.5300 and $0.5320 resistance levels.
XRP price continues to fall
XRP price failed to initiate a fresh rise above the $0.5350 resistance. It started a fresh decline and traded below the $0.5250 support level.
However, losses were limited compared to Bitcoin and Ethereum. The low was formed at $0.5210, and the price is now consolidating losses. There was a slight rally within the range and the price moved above the resistance at $0.5250.
The price cleared the 23.6% Fibonacci retracement level of the downward wave from the $0.5354 swing high to $0.5210 low. The price is currently trading below $0.5320 and the 100-hour simple moving average.
If there is another rise, the price may face resistance near the $0.5300 level. On the hourly chart of the XRP/USD pair, a bearish trend connecting line is also forming with resistance at $0.5285. It is close to the 50% Fibonacci retracement level of the downward wave from the $0.5354 swing high to $0.5210 low.
The first major resistance is near the $0.5350 level. The next key resistance could be $0.5450. A clear move above the $0.5450 resistance could send the price towards the $0.5500 resistance. Further growth could take the price towards resistance at $0.5650 or even $0.580 in the near future. The next major hurdle could be $0.600.
More losses?
If XRP fails to break through the $0.5350 resistance zone, it could start another decline. Initial support on the decline lies near the $0.5220 level. The next major support is near the $0.520 level.
If there is a downside breakout and close below the $0.520 level, the price may continue to decline towards the $0.5150 support in the near future. The next major support is near the $0.5080 zone.
Technical indicators
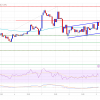
Hourly MACD – The MACD for XRP/USD is now losing momentum in the bearish zone.
Hourly RSI (Relative Strength Index) – The RSI for XRP/USD is currently below the 50 level.
The main support levels are $0.5220 and $0.5200.
The main resistance levels are $0.5350 and $0.5450.