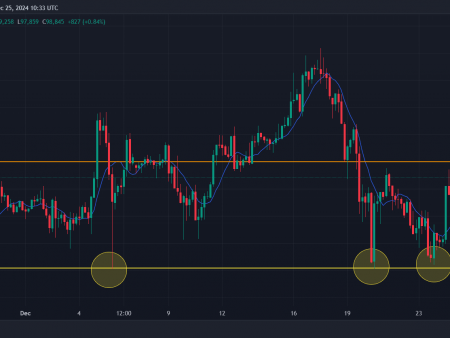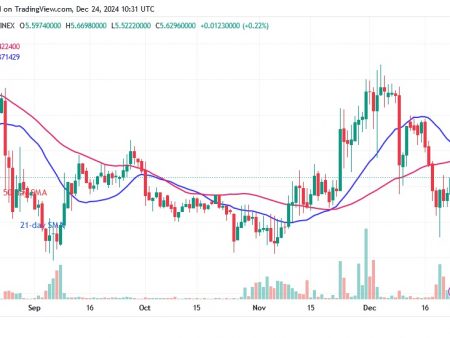
XRP was not the strongest asset on the market this year, but despite this, it does not face any of the problems that we are seeing in Ethereum and Bitcoin. XRP has successfully avoided trouble at $0.48. However, the lack of volatility could end up being a negative factor when the market reversal begins.
XRP was not the strongest asset on the market this year, but despite this, it does not face any of the problems that we are seeing in Ethereum and Bitcoin. XRP has successfully avoided trouble at $0.48. However, the lack of volatility could end up being a negative factor when the market reversal begins.
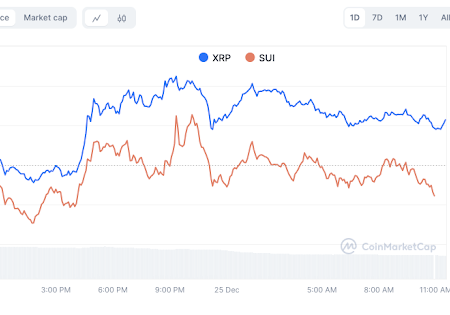
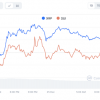
Compared to its peers, XRP has demonstrated exceptional stability in recent months. Throughout the day, XRP was able to maintain its relatively stable price range, while Ethereum and Bitcoin saw substantial fluctuations.
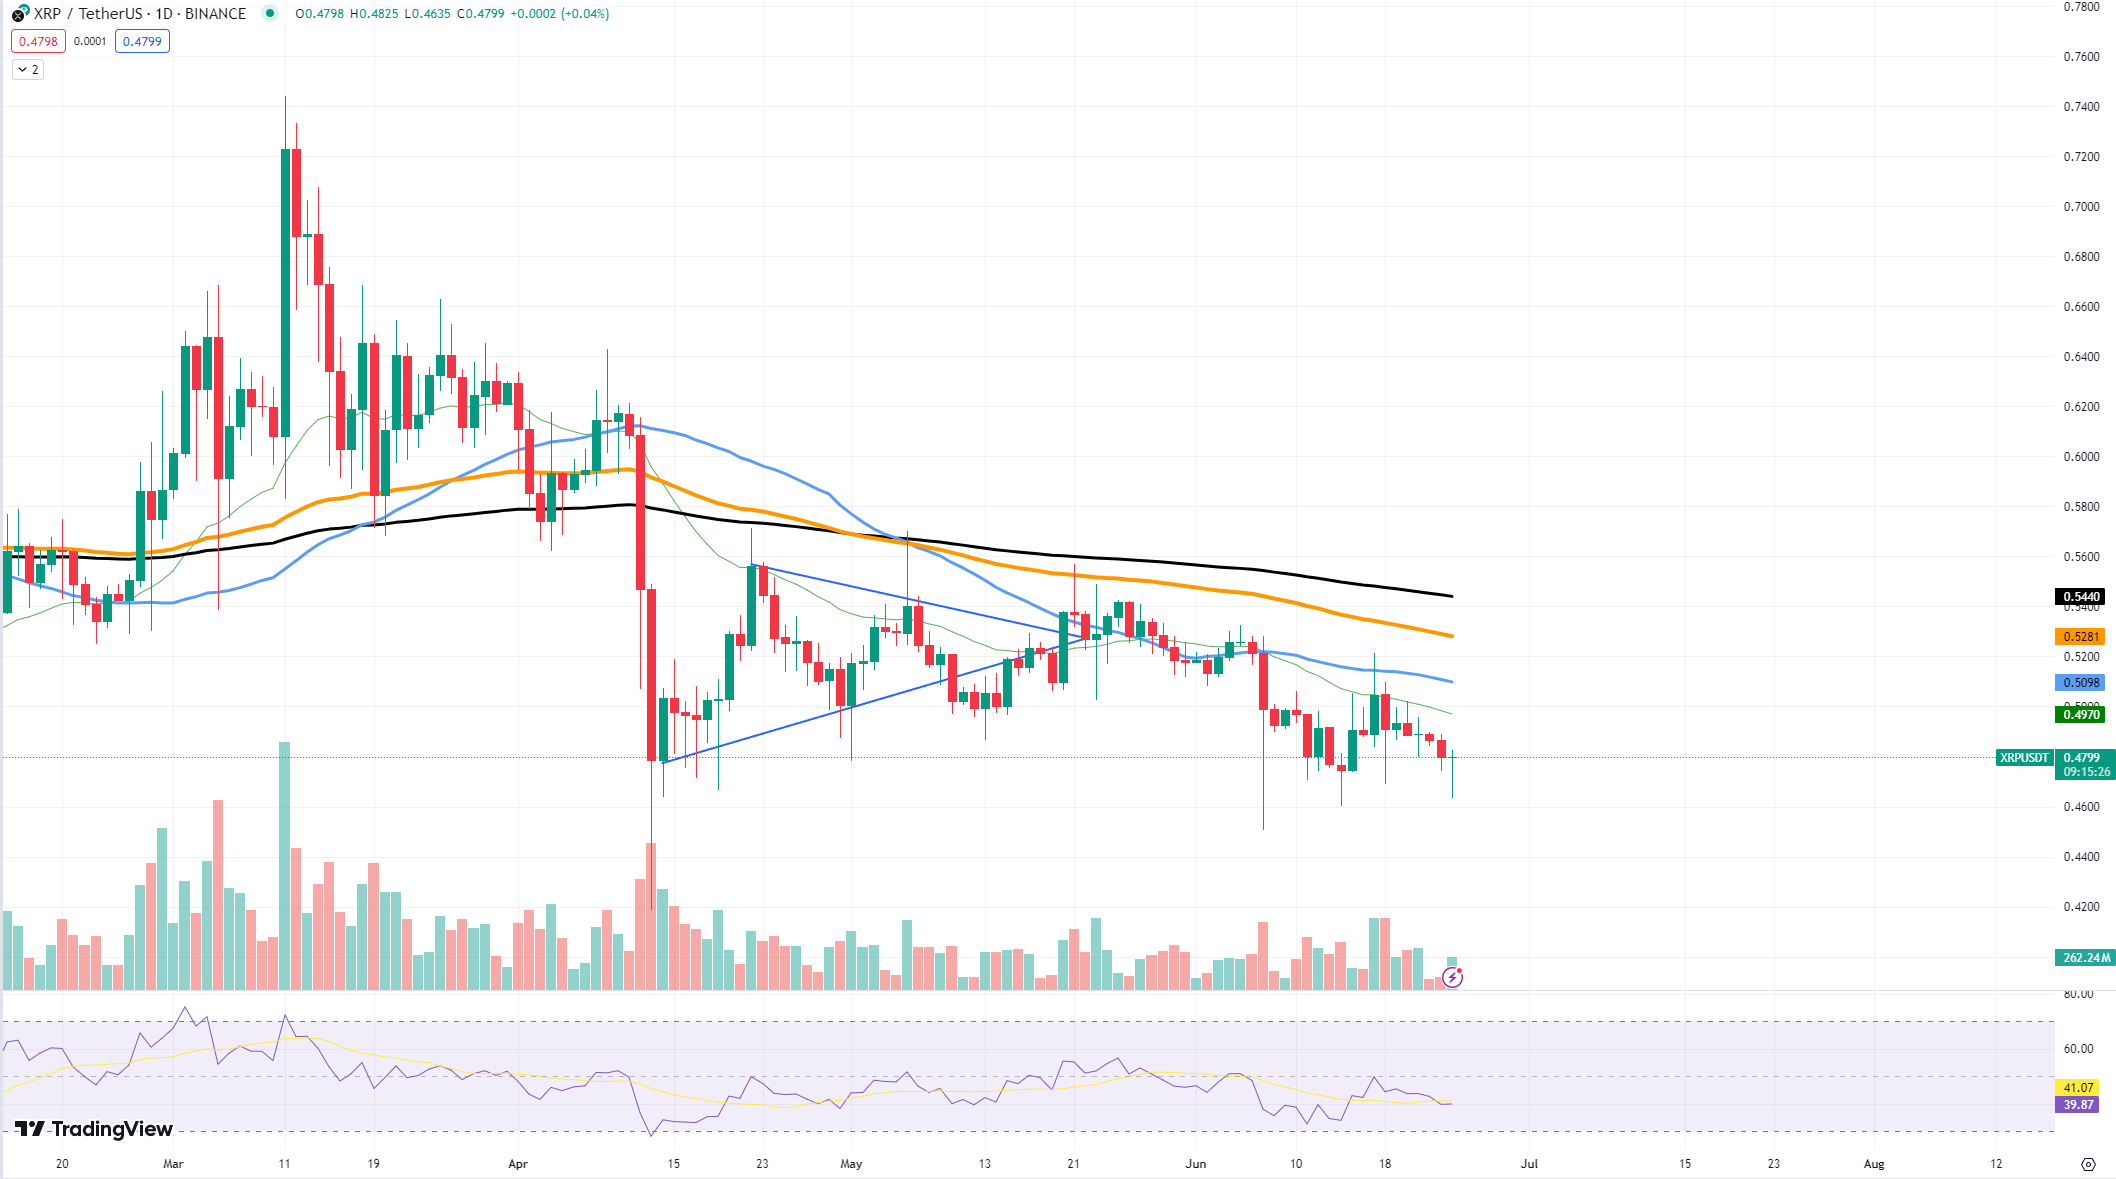
Its constant trading volume and the general attitude of the XRP community are two of the reasons for its stability. At the $0.48 support level, XRP resistance is one of its most important current features. This level has supported possible bullish movements by acting as a base and preventing further declines. XRP’s price consistency suggests that there is a base of investors who are committed and optimistic about the company’s future.

But this stability can also have a drawback. Assets with minimal movement can sometimes go unnoticed by traders looking to make quick profits in a highly volatile market. If XRP persists in trading in a small range, it may lose the speculative interest that often drives notable price increases in other cryptocurrencies.
This lack of volatility for XRP could be an advantage or a disadvantage as the market as a whole looks for a possible reversal. On the one hand, investors who are risk-averse and looking for a safe haven may be attracted to its stability. However, XRP may find it difficult to keep up with more volatile assets that may see sharp increases in value if there is a significant change in market sentiment.
Bitcoin’s critical blow
Even though Bitcoin fell below the $65,000 price threshold, the first cryptocurrency could still show us a substantial reversal in the foreseeable future. The next major support for the asset is at around $57,000, but if we see a rise in buy support right now, there is nothing stopping BTC from reaching $70,000.
The recent drop in Bitcoin prices can be attributed to a number of factors, including increased selling pressure from miners and a shift in overall market sentiment toward caution.
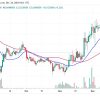
The current technical agreement suggests that a recovery is possible. The 100-day moving average (orange line) at about $64,000 has provided essential support. How the price of Bitcoin moves right now will be crucial in predicting its short-term course.
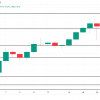
The distribution of liquidity must also be taken into account. The chart shown shows notable liquidity above the $70,000 mark. This implies that if Bitcoin is able to gain strength, a considerable amount of liquidity is waiting to be released, which could cause a sharp rise in price. It is advisable that market players monitor the volume of transactions.
An increase in trading volume combined with an improvement in the RSI could signal the start of a reversal. Additionally, macroeconomic variables and encouraging reports on Bitcoin acceptance or regulatory clarity may offer the necessary impetus for a price increase.
The collateral damage of Ethereum
Ethereum did not avoid the blow that Bitcoin received. The second-largest cryptocurrency on the market plummeted to $3,300, which is not the lowest level for Ether we saw this month. Just a week ago, ETH already tested this support level, which could be a sign of an upcoming reversal in the future.
Ethereum’s recent drop is part of a broader market trend in which there is more pressure on sellers of major cryptocurrencies. However, ETH’s current position at the $3,300 support level is very important. Historically, this level has served as important support that offers a solid foundation for future upward moves.
Ethereum appears poised for a reversal based on technical indicators. At the moment, the 100-day moving average serves as a crucial support level and the Relative Strength Index on the daily chart is approaching oversold values.
The increase in volume may indicate that buyers are entering the market with this support level, which could push the price higher. Ethereum could attract more buying interest and pave the way for a possible comeback if it can hold above this crucial support.

 Alex Dovbnya
 Godfrey Benjamin
 Yuri Molchan