- Ethereum is trading at $3,444 with a market cap of $415.01 billion and a trading volume of $20.12 billion.
- Endaoment sold 3,690 ETH for $12.47 million in its largest sale in history.
Ethereum (ETH) is currently trading at $3,444.79, up 1.28% over the last 24 hours. Its market capitalization is $415.01 billion, reflecting an increase of 1.29%, and its 24-hour trading volume increased by 18.09% to $20.12 billion. Ethereum has a circulating supply of 120.47 million ETH, with no maximum supply cap.
Recently, Endaoment, an Ethereum-based charity, sold 3,690 ETH worth $12.47 million in a single transaction—their first sale in 10 months and the largest ever. The ETH came from an Ethereum ICO participant who received 100,000 ETH on Genesis in 2015. So far, the participant has sold 14,990 ETH at an average price of $2,409, including 13,190 ETH through Endaoment, and still has 85,000 ETH ($293.8 million) in two wallets.
Ethereum’s fully diluted valuation of $415.01 billion is in line with its market capitalization, and its volume to market capitalization ratio is 4.89%, highlighting significant trading activity. The recent increase in trading volume reflects increased investor interest despite broader market uncertainty.
Technical indicators for ETH
Ethereum is below the 21-day moving average ($3,503.89), acting as immediate resistance. The 9-day moving average ($3,371.37) serves as a critical support level. A bearish crossover signals potential downward pressure when the 9-day average is below the 21-day average. If ETH falls below $3,371, it could fall to $3,200. Conversely, a break above $3,779, a key resistance, could trigger a rally towards $4,000.
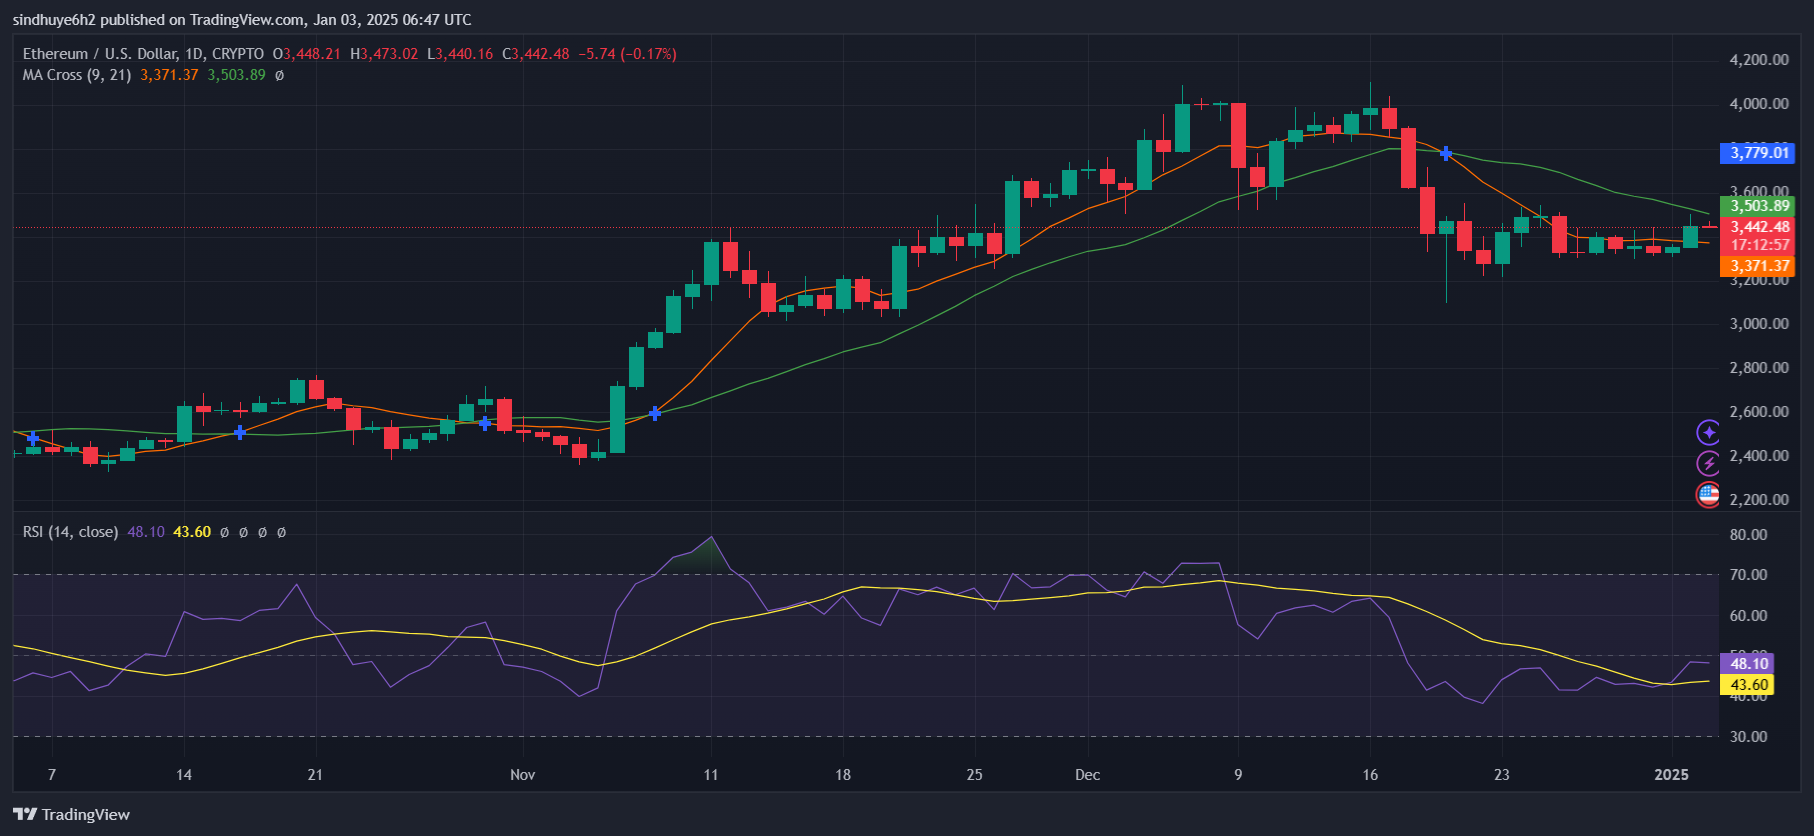
The Relative Strength Index (RSI) is at 43.60, reflecting weak momentum and indicating that sellers currently have the upper hand. The average RSI reading of 48.10 suggests the market is close to neutral territory but has not yet demonstrated significant buying power. A recovery in the RSI above 50 could signal a bullish reversal.
Moving Average Convergence Divergence (MACD) indicates declining bullish momentum as the histogram bars have become narrower. A bullish MACD line cross will be important for upward momentum.
The $3,371 support zone coincides with the 50-day exponential moving average (EMA), adding to its significance. Resistance at $3,779 coincides with the previous high, forming a critical price level to watch. A break of this level will confirm a higher high, which is necessary to maintain bullish sentiment.
A bearish crossover and a decline in the RSI indicate short-term consolidation or further declines if the bulls fail to reclaim $3,500. However, high trading volumes and sustained activity among early ICO participants demonstrate continued confidence in Ethereum’s long-term fundamentals.
