According to the latest price analysis from Coinidol.com report, Toncoin (TON) price has fallen below its moving average lines after hitting $7.20.
Long-term Toncoin price forecast: bearish
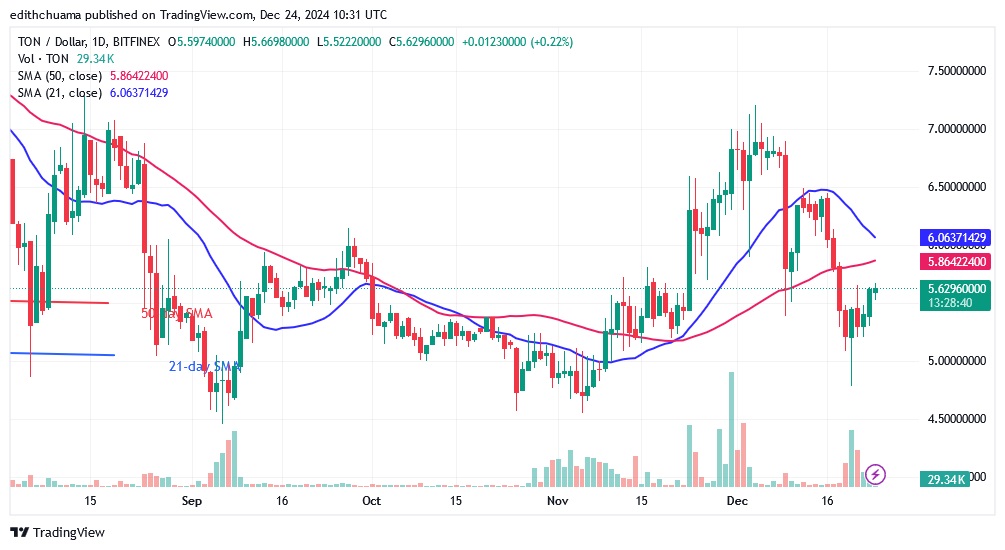
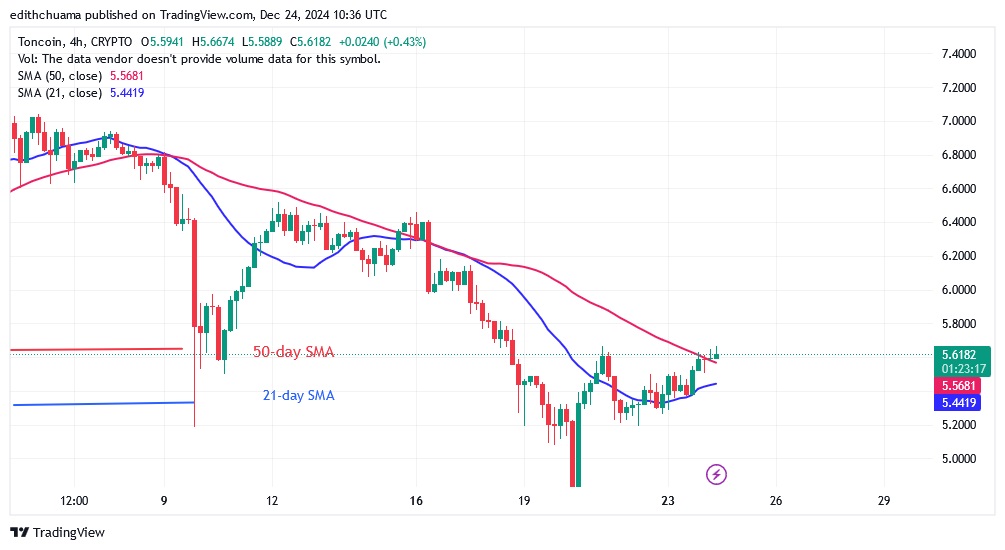
The cryptocurrency fell to a low of $4.78 before rising within a range above the $5.00 support and below the moving average lines. TON is correcting higher, reaching the 50-day simple moving average line. The current uptrend is likely to be broken at the 50-day SMA line. However, a break above the moving average lines will mean a continuation of the uptrend. However, if TON falls below the 50-day SMA, selling pressure will increase again. On the downside, TON will fall to the $3.65 low if the bears break through the $5.00 support. TON is currently trading at $5.64.
Analysis of Toncoin indicators
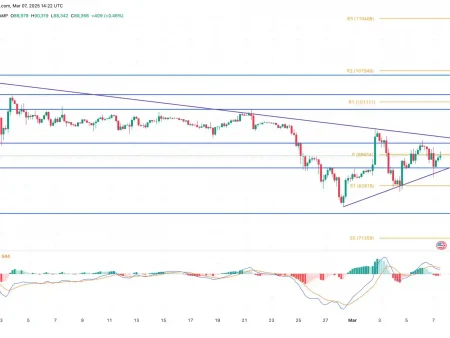
Price bars are below moving average lines while the cryptocurrency is falling. Currently, the altcoin is in an upward correction, approaching the moving average lines. On the 4-hour chart, price bars are above the moving averages. TON will rise as long as it remains above the moving average lines.
Technical indicators
Resistance levels: $6.00, $8.00, $10.00.
Support levels: $5.00, $3.00, $1.00.
What’s Toncoin’s next step?
On the 4-hour chart, TON is rising as price bars are above the moving average lines. The altcoin will reach a high of $6.20, but may be rejected at this price. On the daily chart, TON will resume its uptrend if buyers hold the price above the moving average lines and overcome the $6.50 resistance.
Disclaimer. This analysis and forecast are the personal opinion of the author. They are not a recommendation to buy or sell cryptocurrency and should not be considered an endorsement by CoinIdol.com. Readers should conduct research before investing in the funds.
