Bitcoin (BTC) has been consolidating above $35,000 for several days, but the bulls have failed to resume the uptrend above $38,000. This suggests hesitation to buy at higher levels. BitGo CEO Mike Belshe said in a recent interview with Bloomberg that there will likely be another round of rejections of Bitcoin exchange-traded fund applications before they are finally approved.
Several analysts believe that Bitcoin will enter a correction in the short term, with the worst outcome projecting a drop to $30,000. However, the decline is unlikely to start a bearish phase. Look Into Bitcoin creator Philip Swift said on-chain data suggests the Bitcoin bull market is still in its early stages as “there is no FOMO yet.”
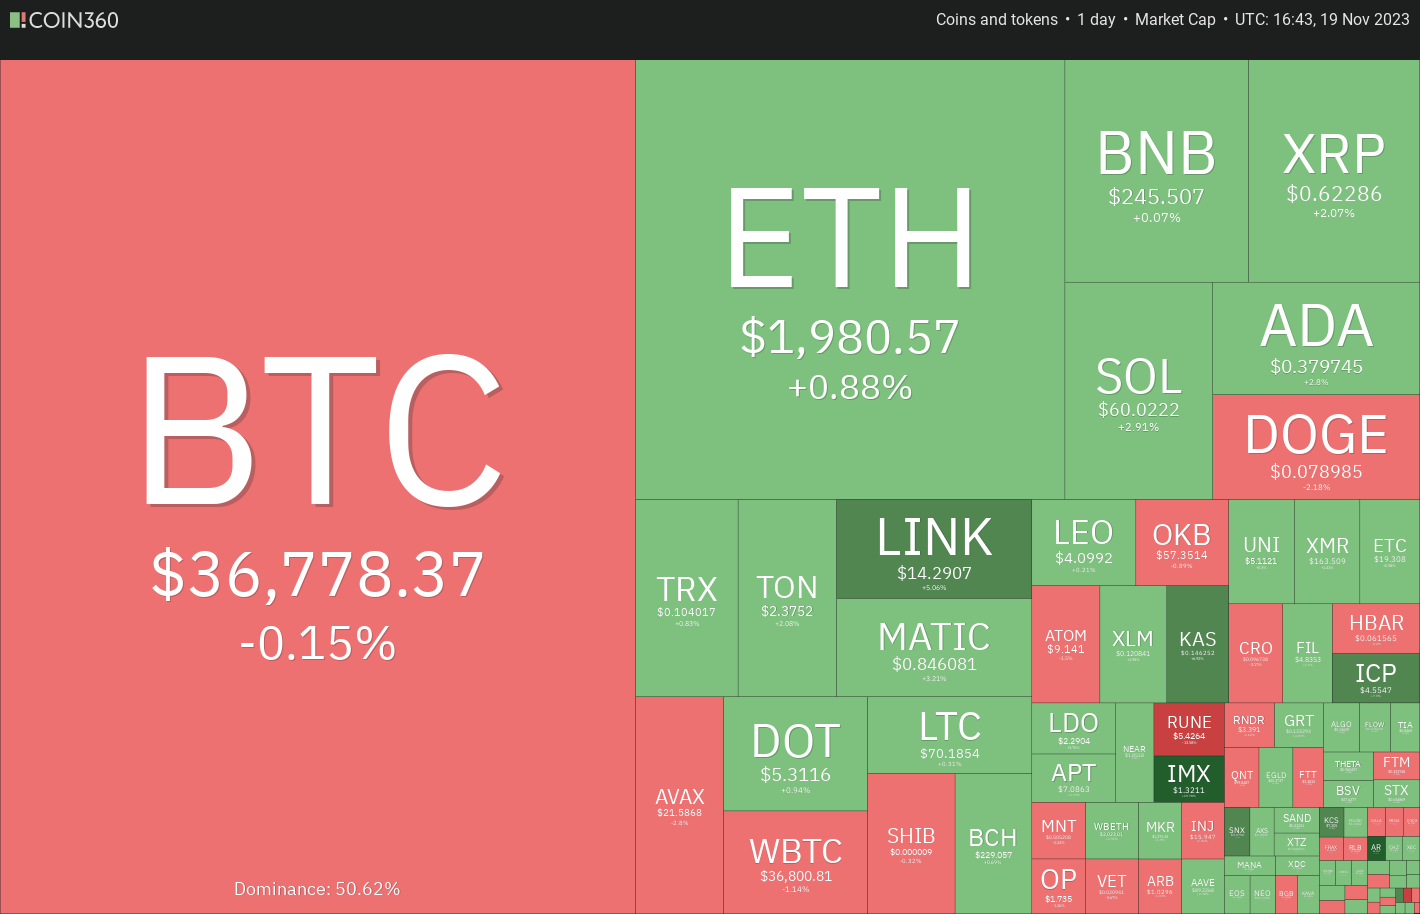
As Bitcoin takes a breather, several altcoins have witnessed a pullback, but some are showing signs of resuming their bullish trends. Fidelity and BlackRock applications filed for an Ether spot ETF show strong investment demand in select altcoins.
Could Bitcoin stay above $35,000 in the coming days? Is it time for altcoins to begin the next stage of their upward movement? Let’s look at the charts of the top 5 cryptocurrencies that may rise in the short term.
Bitcoin price analysis
Bitcoin is facing strong resistance near $38,000, but a positive sign is that the bulls have not allowed the price to fall below the 20-day exponential moving average ($35,666).
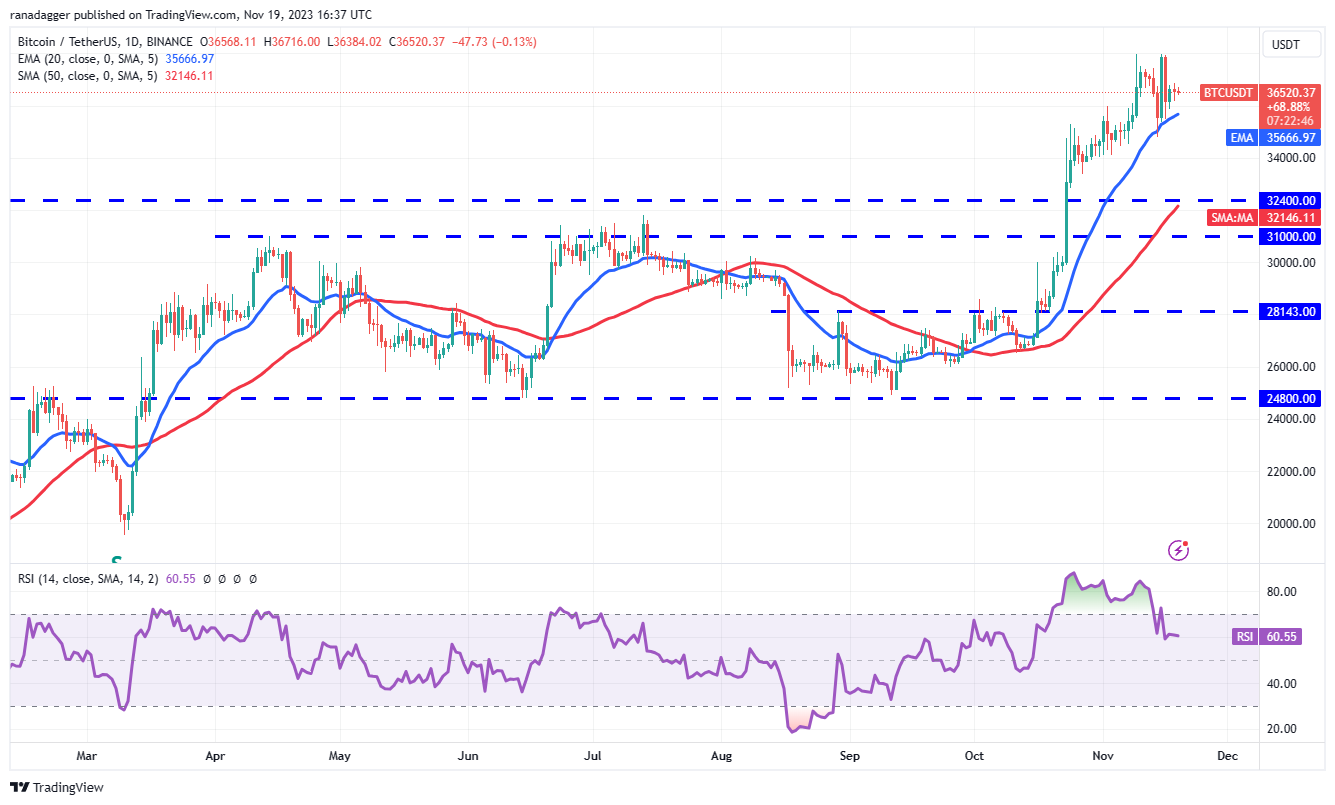
The ascending moving averages and the relative strength index (RSI) in the positive zone indicate that the bulls have the upper hand. If the price bounces off the 20-day EMA, the bulls will make one more attempt to clear the $38,000 hurdle.
If they are successful, the BTC/USDT pair can reach $40,000. This level may witness aggressive selling by the bears, but if buyers bulldoze their way in, the rally could reach $48,000.
The first sign of weakness will be a close below the 20-day EMA. This will indicate the possibility of limited action in the short term. The pair may remain stuck between $34,800 and $38,000 for a while. A break below $34,800 could clear the way for a fall to $32,400.
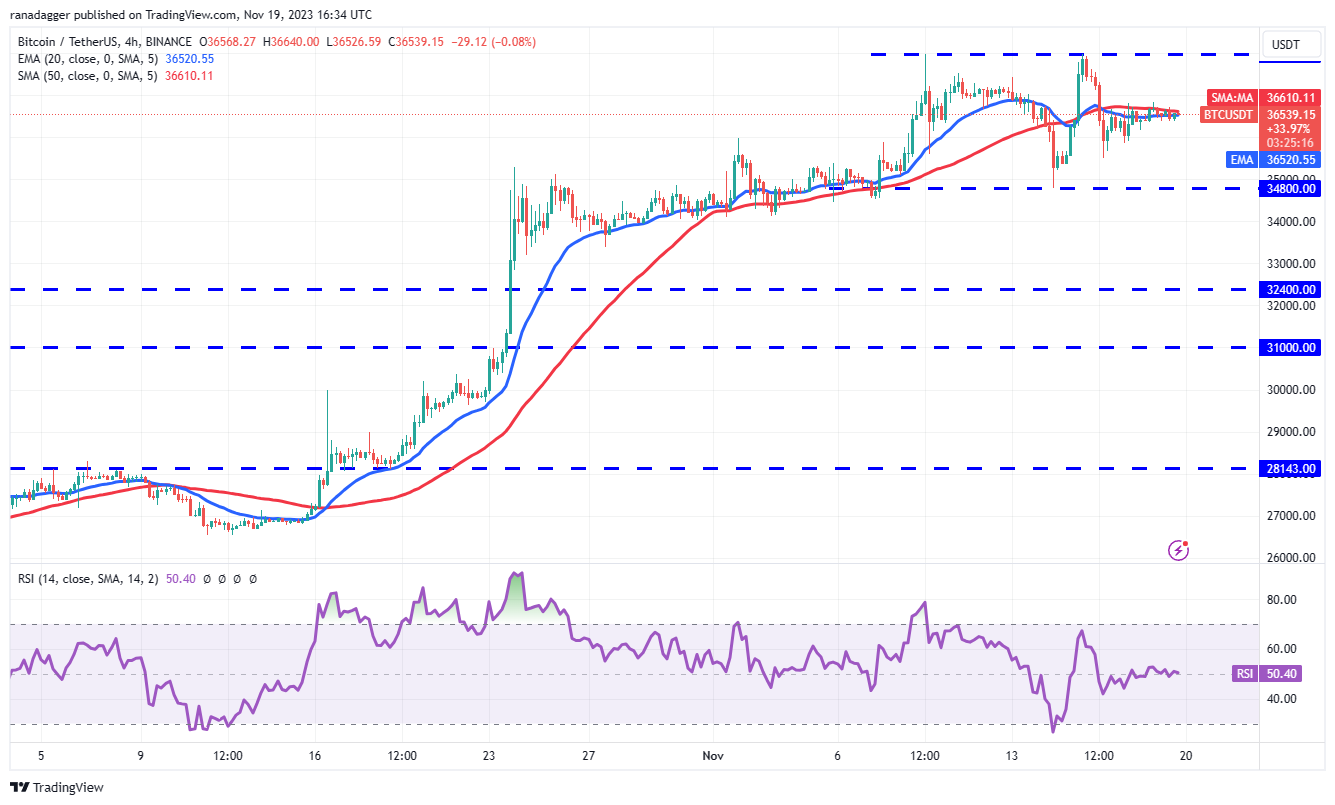
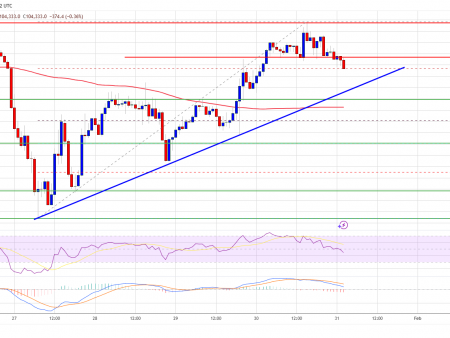
The 4-hour chart shows that the price is fluctuating between $38,000 and $34,800. Both moving averages have stabilized and the RSI is close to the midpoint, indicating that the range-bound action may continue for longer.
A tight consolidation near the 52-week high is a positive sign as it shows that the bulls are not closing their positions hastily. That increases the probability of a bullish breakout. If that happens, the pair may resume the uptrend. The short-term trend will favor the bears in case of a break below $34,800.
Solana Price Analysis
Solana (SOL) fell below the breakout level of $59 on November 16, but the bears were unable to take advantage of this advantage. This indicates that sales dry up at lower levels.
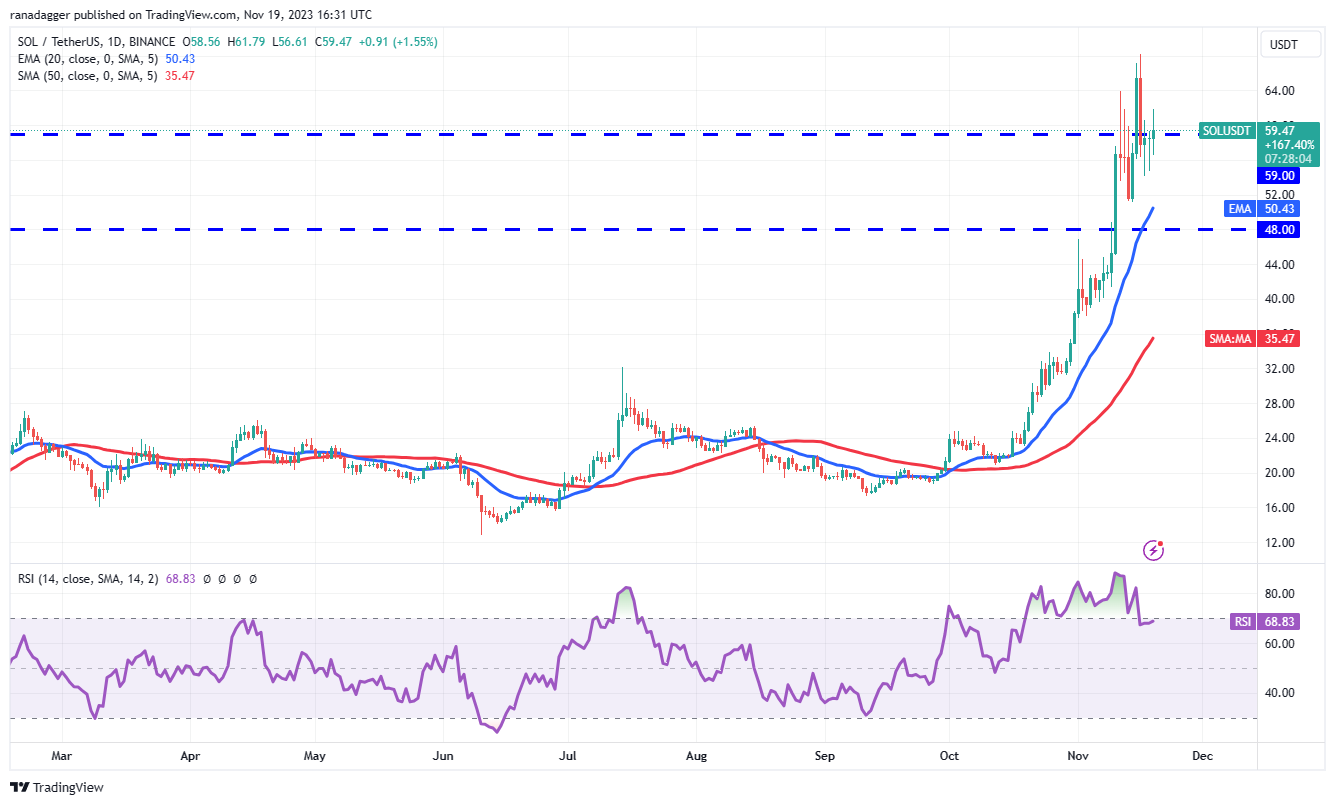
The bulls are again trying to push the price above $59. If they do, it will indicate that the markets have rejected the lower levels. The SOL/USDT pair could rise to $68.20. If this level is scaled, the pair may resume the uptrend. The next upside target is $77 and then $95.
This bullish move will be invalidated if the price declines and falls below $48. That could initiate a steeper correction to the 50-day SMA ($35.47). The deeper the decline, the longer it will take for the next leg of the uptrend to begin.
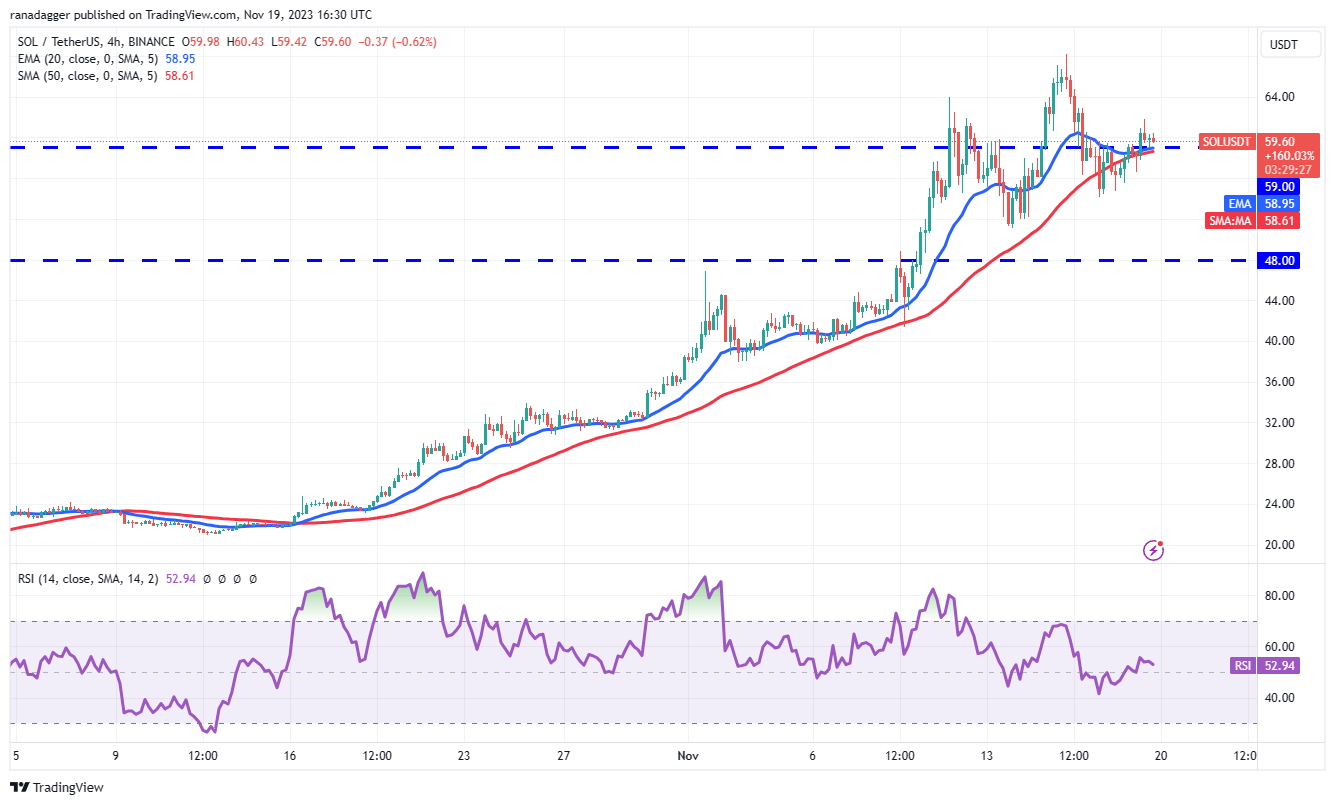
The 20 EMA is flattening and the RSI is just above the midpoint, indicating a balance between supply and demand. If buyers push the price above $64, the pair may challenge the local high of $68.20.
On the other hand, if the price declines and falls below $54, it will suggest that the bears are back in the game. Then, the pair may fall to $51 and finally to the strong support of $48. A break below this level will tilt the advantage in favor of the bears.
Chain price analysis
Chainlink (LINK) pullback finds support at the 20-day EMA ($13.42), indicating that lower levels continue to attract buyers.
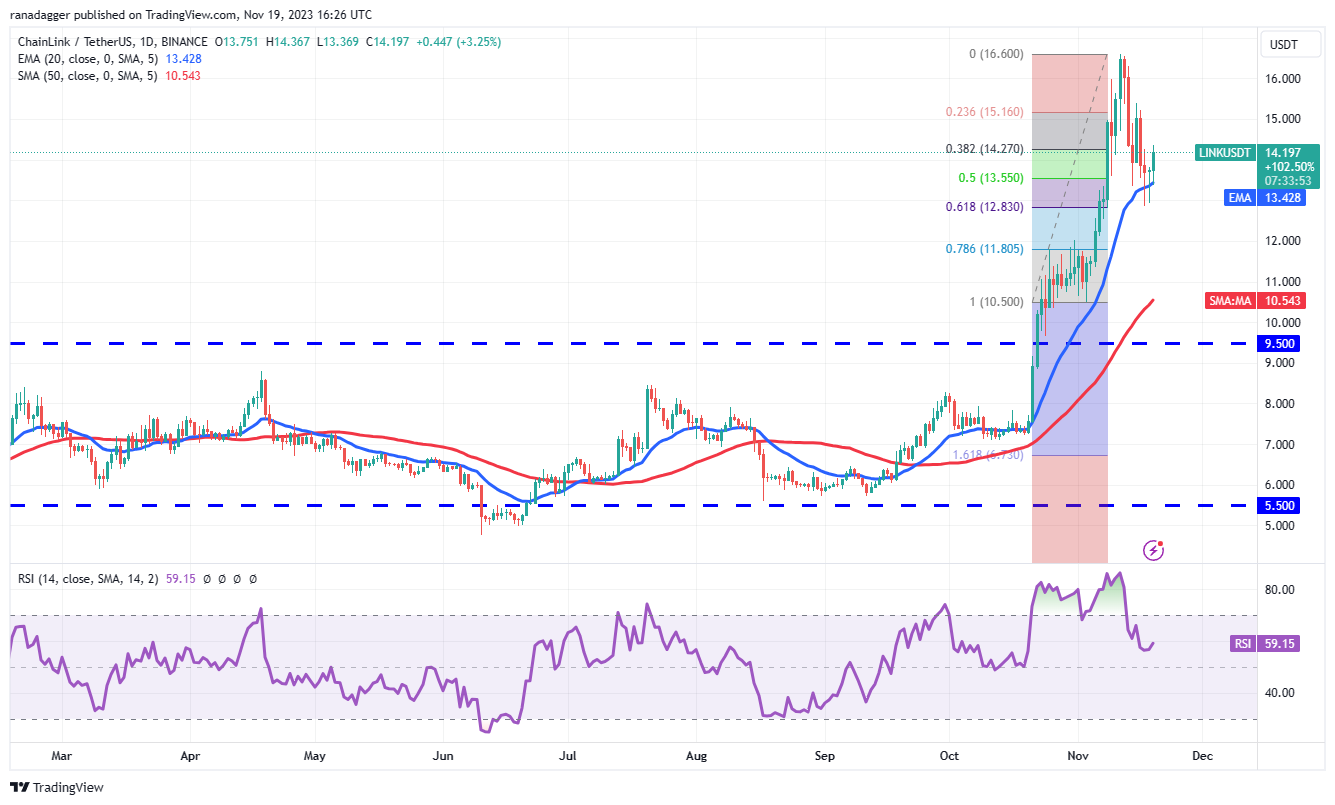
Next, the bulls will try to push the price to the local high of $16.60. This level may witness a tough battle between the bulls and the bears, but if this barrier is broken, the LINK/USDT pair could start the next leg of the uptrend to $20.
On the other hand, if the price drops below $15.38, it will indicate that the bears are selling on the rallies. They will then try to sink the price below the 61.8% Fibonacci retracement level of $13.55. If they manage to do so, the pair may fall to the 50-day SMA ($10.54).
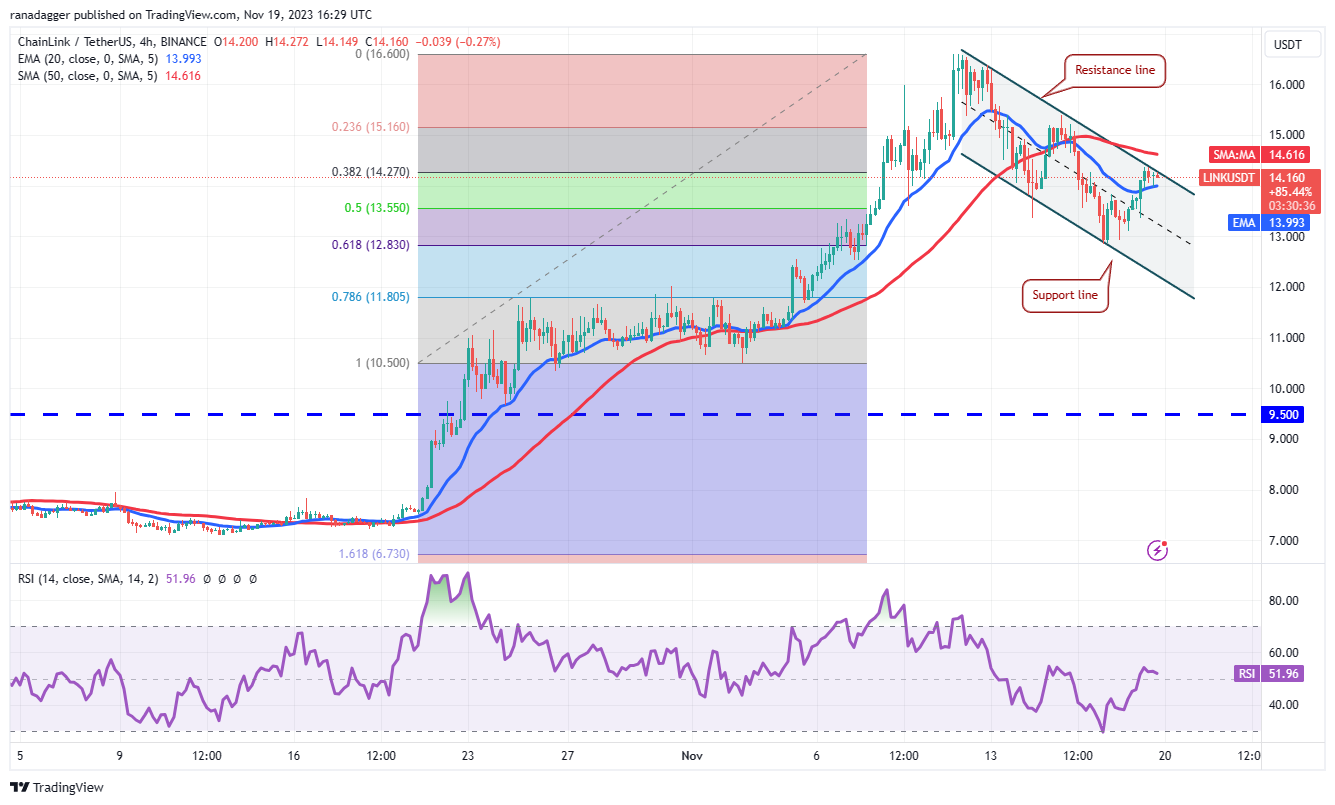
The pair has been falling within a descending channel pattern for the past few days. Generally, traders sell near the resistance line of the channel, and that is what they are doing. If the price falls below $13.36, the doors will open for a drop to the support line.
On the contrary, if buyers push the price above the channel, it will suggest that the correction may be over. The pair may rise first to $15.38 and subsequently to $16.60. The flat 20-EMA and the RSI near the midpoint do not give a clear advantage to either the bulls or the bears.
Related: One year later: Top 3 winners after ‘FTX collapse’
Near Protocol Price Analysis
Near Protocol (NEAR) rose and closed above the formidable resistance of $1.72 on November 17. This movement indicates a possible trend change in the short term.
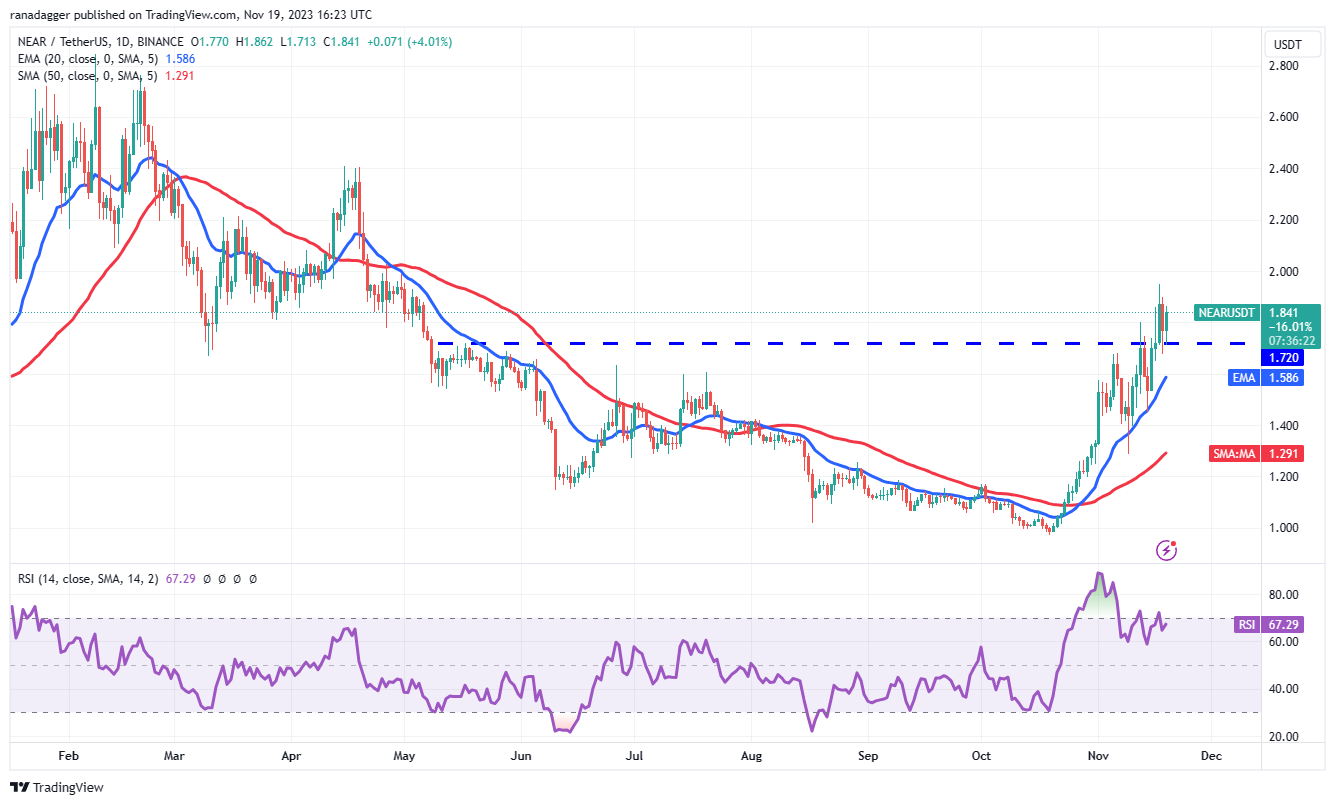
The rising 20-day EMA ($1.58) and the RSI in the positive zone indicate that the bulls are in charge. There is minor resistance at $2. The NEAR/USDT pair can rise to $2.40 if this hurdle is cleared.
Meanwhile, the bears likely have other plans. They will try to push the price back below the breakout level of $1.72 and catch the aggressive bulls. Then, the pair could fall to the 20-day EMA. This is still the critical level to pay attention to because a drop below it will indicate that sellers are back in the game.
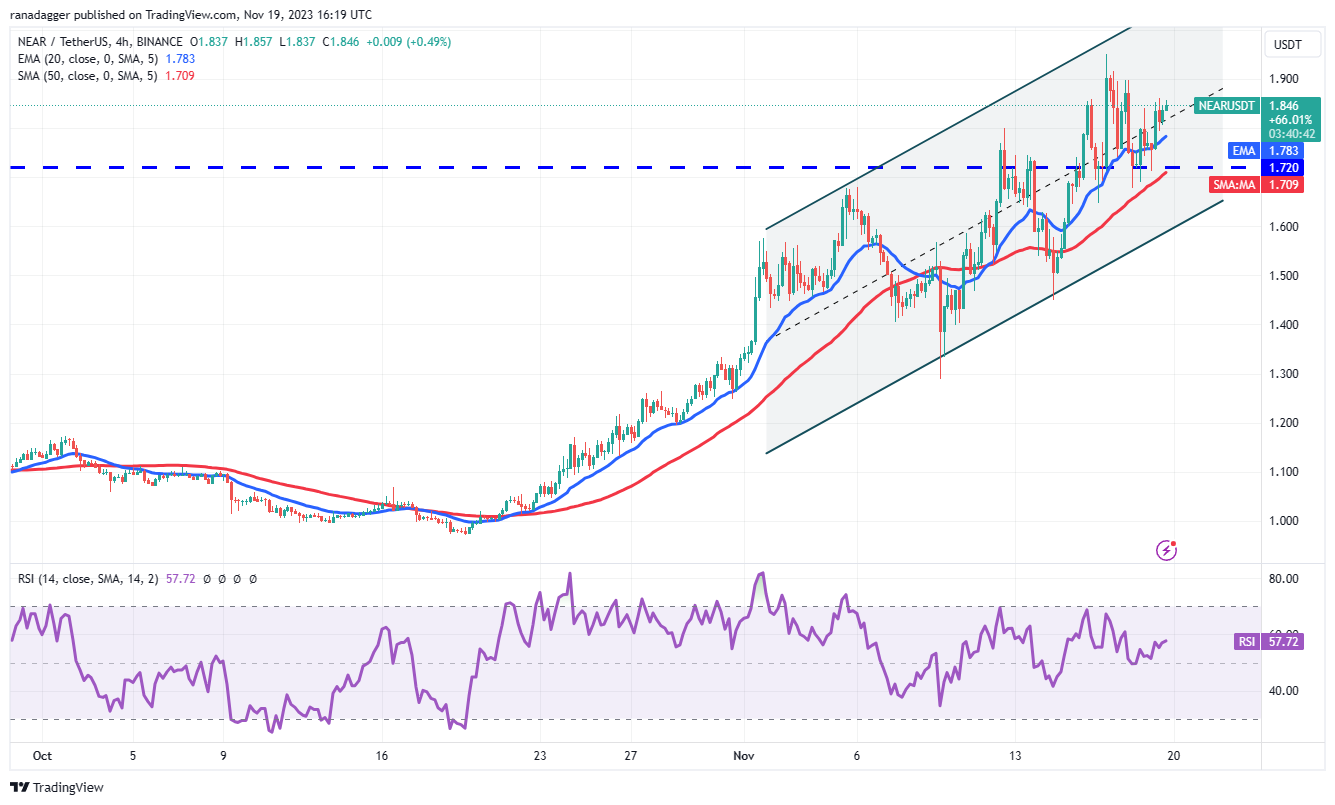
The pair has held above the breakout level of $1.72, but the bulls have failed to initiate a strong upward move. This suggests that the bears have not given up and are trying to push the price back below $1.72.
If they can achieve this, the price may drop to $1.60. If this level fails, several shutdowns may be triggered. The pair may then fall to $1.45 and subsequently to $1.28. On the contrary, if buyers push the price above $1.95, the pair may begin its march towards $2.10.
Theta Network Price Analysis
Theta Network (THETA) is finding support at the 20-day EMA ($0.88) after undergoing a correction in recent days. This indicates that sentiment remains positive and traders view dips as a buying opportunity.
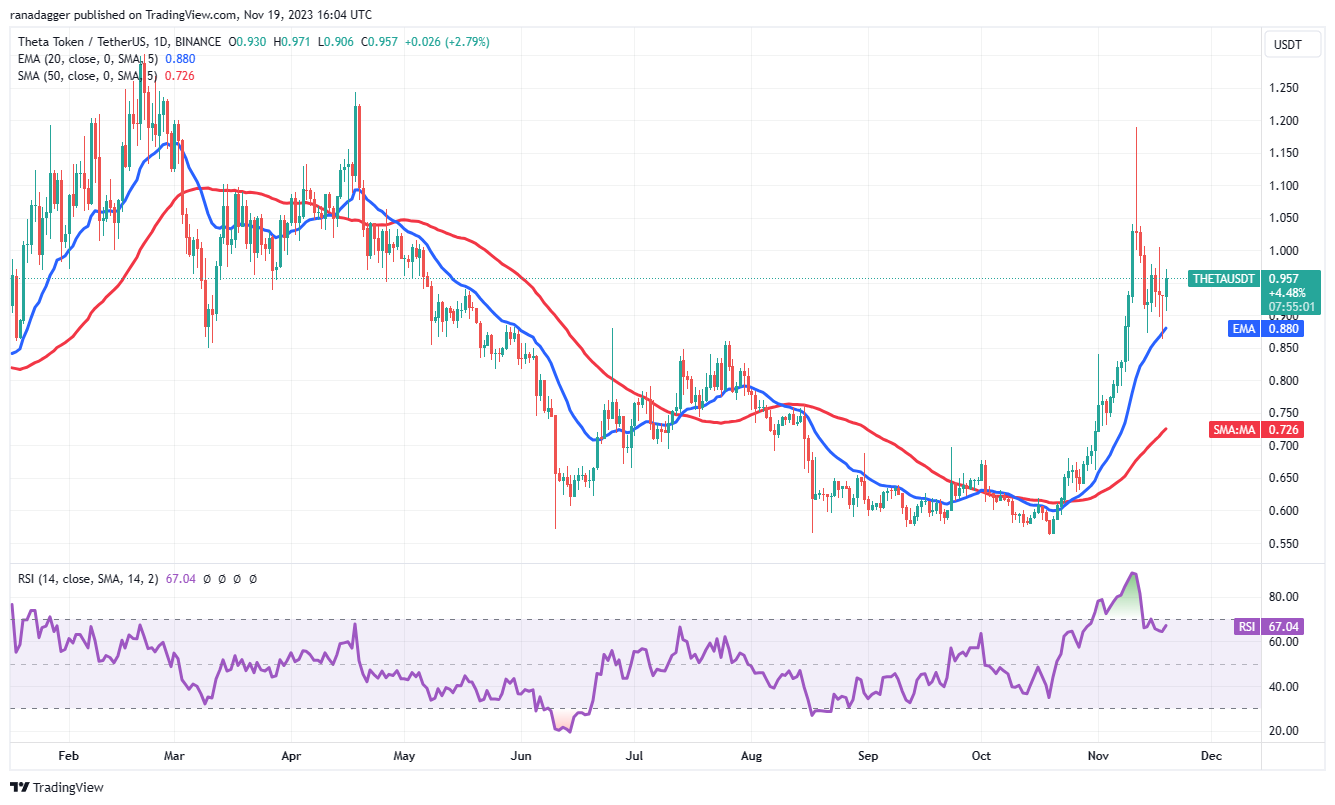
The bounce from the 20-day EMA is likely to face resistance at the psychological level of $1. If this level is conquered, THETA/USDT pair could gain momentum and rise to $1.05 and then $1.20. This level may again act as a strong hurdle, but if it is broken, the pair may shoot up to $1.33.
If the bears want to avoid the rally, they will have to quickly lower the price below the 20-day EMA. That will indicate that the bulls may be running for the exit. Then, the pair may start a deeper correction towards the 50-day SMA ($0.72).
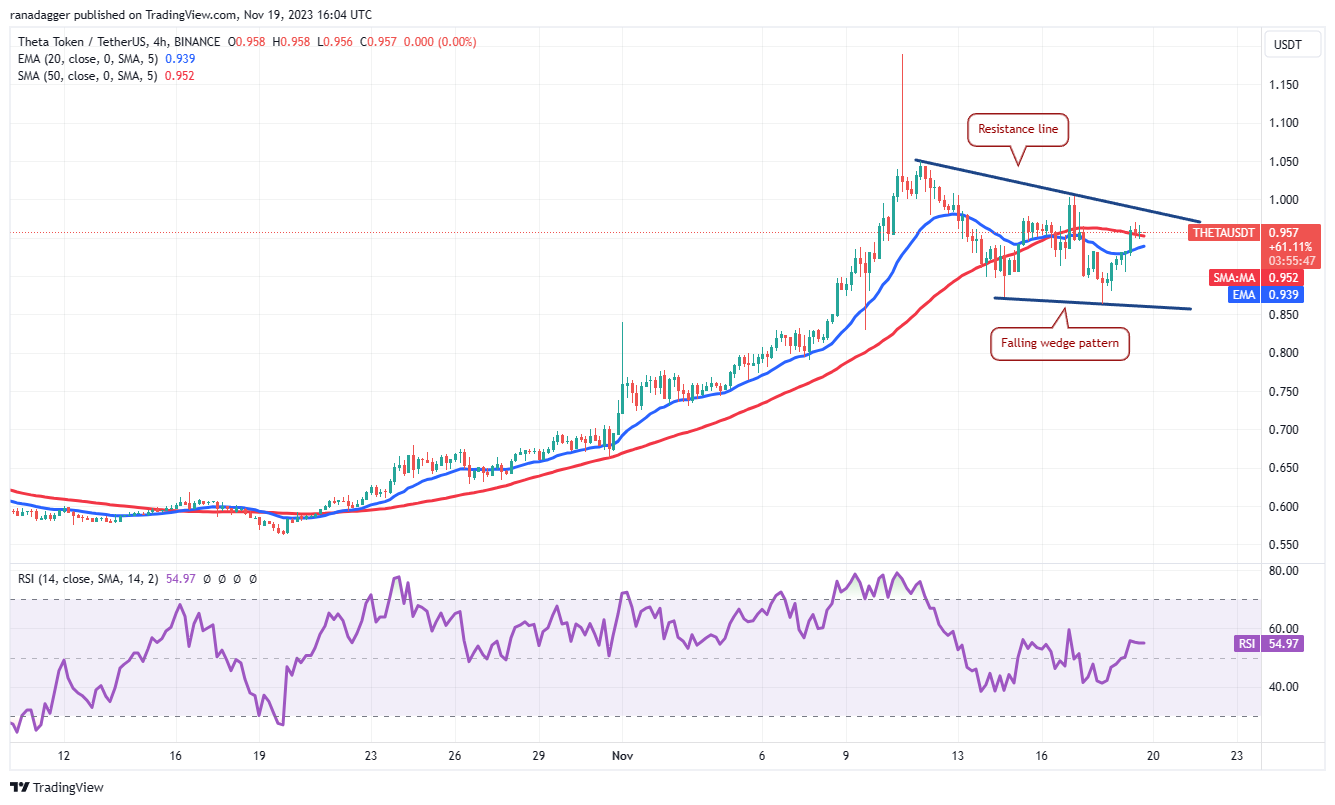
The pair has been correcting within a falling wedge, which generally acts as a bullish setup. Buyers will need to break and hold the price above the wedge to indicate strength. The pair may first rise to $1.05 and then retest the resistance at $1.20.
On the contrary, if the price turns down from the resistance line, it will suggest that the pair may remain trapped inside the wedge for longer. Sentiment is likely to turn bearish if it falls below the wedge.
This article does not contain investment advice or recommendations. Every investment and trading move involves risks, and readers should conduct their own research when making a decision.
- theta