Since the beginning of November, the SOL token has shown sustained bullish sentiment as its price has broken through key resistance levels. During this bullish reign, the cryptocurrency surged more than 70% from a one-month low of $155.10 to a new all-time high of $264.53. However, after this record high spike, Solana’s SOL recovered and returned to the $230 support level.
TradingView’s weekly chart shows that this support level represents a critical zone backed by historical data, offering a solid foundation for a potential recovery. However, the question remains: will this support level continue to remain strong amid market volatility, or will the SOL token face further downward pressure in the coming days? For a comprehensive analysis of SOL’s potential, check out our detailed Solana price forecast to gain insight into upcoming milestones and market trends.
Solana Weekly Forecast: Mixed Market Signals
From a technical perspective, the RSI on the weekly chart is moving down from overbought territory of 70, indicating a weakening bullish outlook for the SOL token. At the moment, the indicator is located at 64.44 above the signal line of 56.39. This shows the resilience of Solana bulls despite weakening RSI sentiment, which could hint at a possible change in momentum if it continues in the coming days.
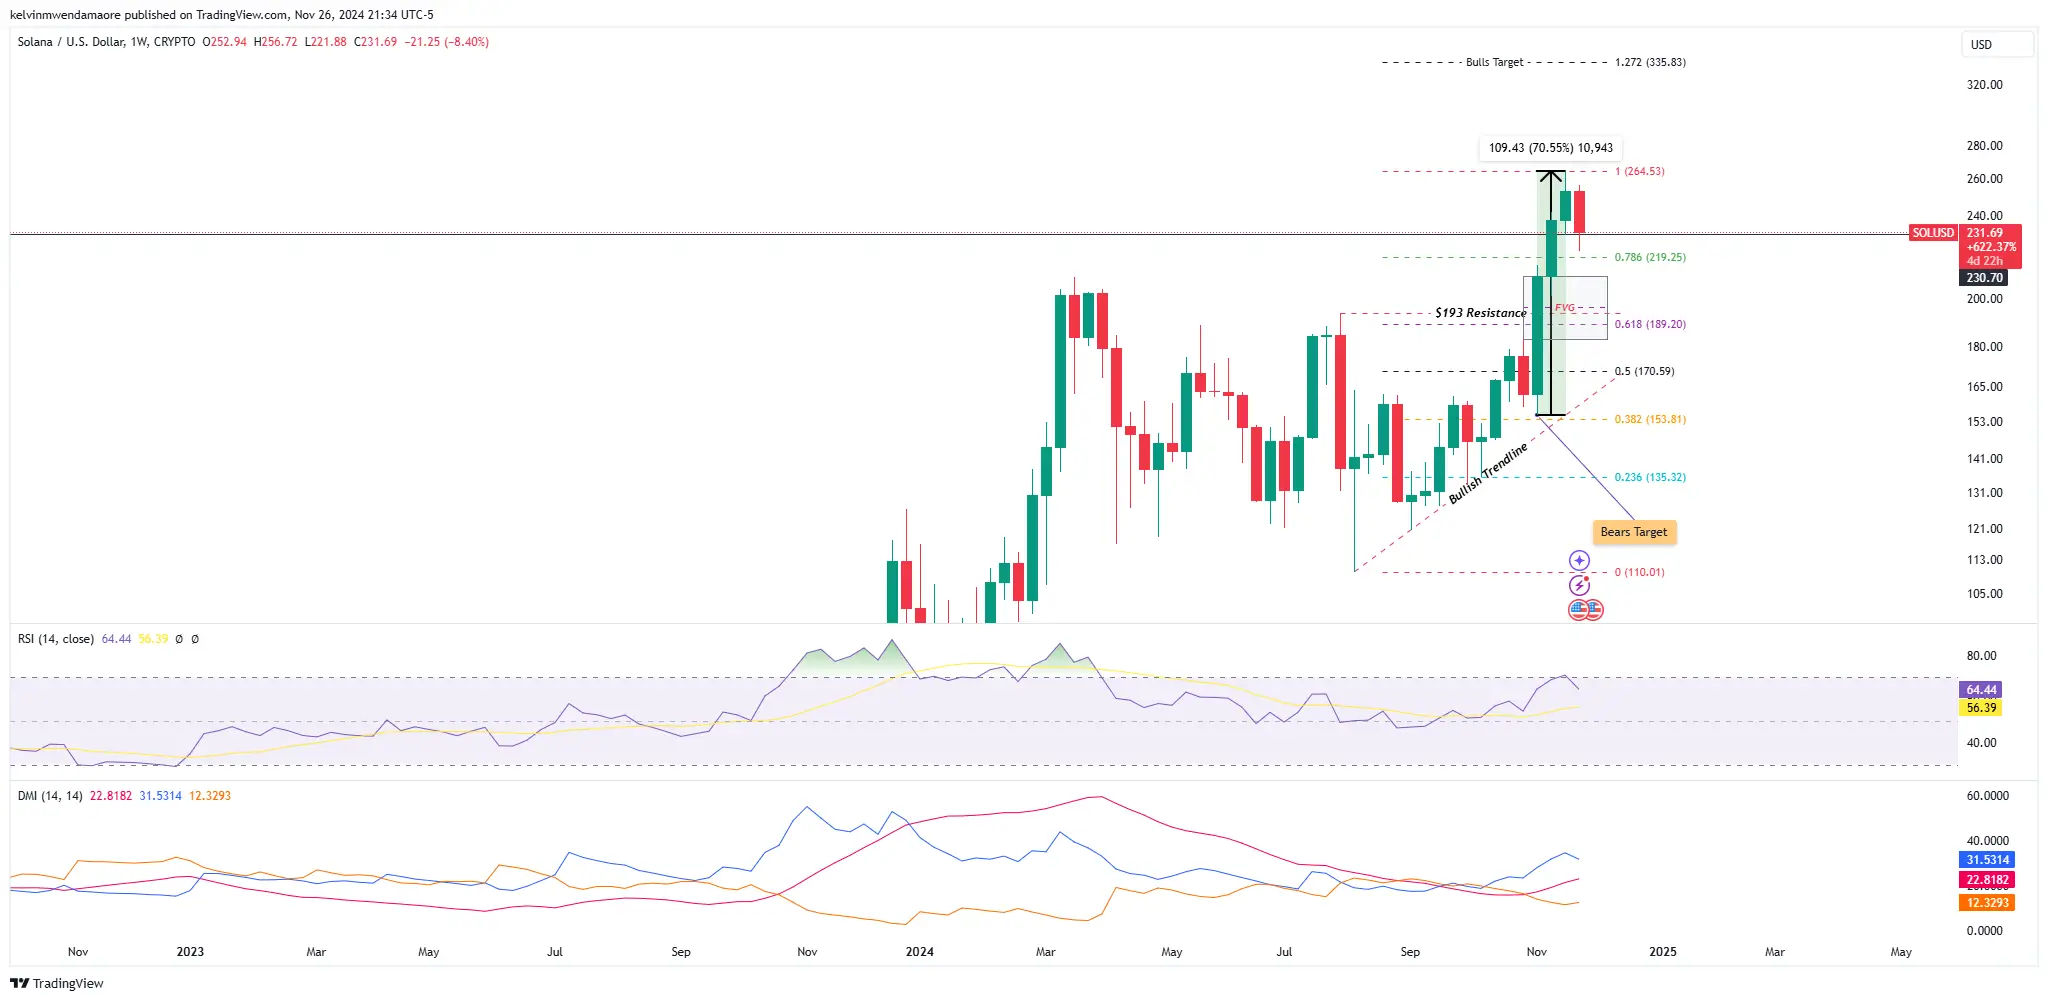
On the other hand, the directional movement index indicates a bullish outlook that is still in control of the SOL cryptocurrency. This is evident as the positive directional indicator (+DI) at 31.5314 is ahead of the negative directional indicator (-DI) at 12.3293. The Average Directional Index (ADX) at 22.8182 also indicates that the bullish trend is still strong and may continue.
SOL Price Analysis: Will SOL’s $230 Support Level Hold?
This scenario represents increased volatility in the SOL cryptocurrency market with the possibility of price fluctuations in any direction. However, for the token to continue its upward trajectory, it must decisively break above the $241 and $256 highs and avoid further declines below the $230 threshold. The success of this move could ultimately lead to the breaking of the all-time high with the possibility of reaching new price levels.
Such a move is inevitable, fueled by the RSI returning to the overbought 70 mark and the DMI strengthening with ADX above 25 with a target of reaching $300 by early December. Conversely, a weekly close below the $230 support level could signal a trend reversal. Such a move could push the SOL cryptocurrency back to its previous lows of around $219, which corresponds to the 78.6% Fibonacci retracement level. A break below this level could push the altcoin towards a fair value gap between $210 and $183, potentially setting the stage for another move higher.
