Shiba Inu recently experienced a staggering 40% drop in value. This sudden change is a stark reminder of the volatility inherent in the cryptocurrency market, particularly in assets that have gained popularity at an explosive rate.
Shiba Inu recently experienced a staggering 40% drop in value. This sudden change is a stark reminder of the volatility inherent in the cryptocurrency market, particularly in assets that have gained popularity at an explosive rate.
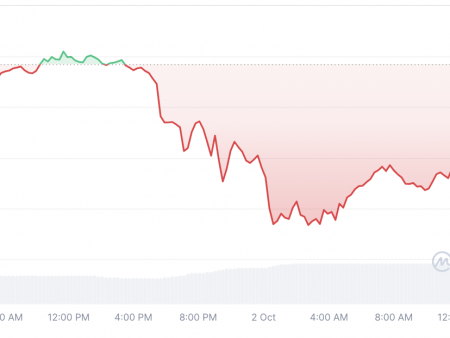
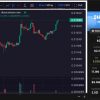
The SHIB chart reflects the turbulence, with the price falling from recent highs, breaking several local support levels. After peaking, SHIB found temporary support around the $0.00002789 mark, which aligns with the lower end of the Bollinger Bands on the daily chart.
On the other hand, resistance is now forming at the $0.000032 mark, where SHIB previously stabilized during its uptrend. This level now represents a challenge that bulls must overcome if they hope to reignite bullish momentum.
Traders should keep an eye on the RSI, which has fallen significantly, approaching oversold conditions. This indicator suggests that selling pressure could be reaching its climax, presenting an opportunity for a price reversal if buying interest resurfaces.
Given SHIB’s propensity for rapid and dramatic price movements, the current downturn could be a prologue to future volatility. It’s entirely possible that moves like the recent drop could happen again as market sentiments change and new investors enter and exit the space. It is this same volatility that attracts traders seeking high-risk, high-reward opportunities within the cryptocurrency market.
Solana shows resilience
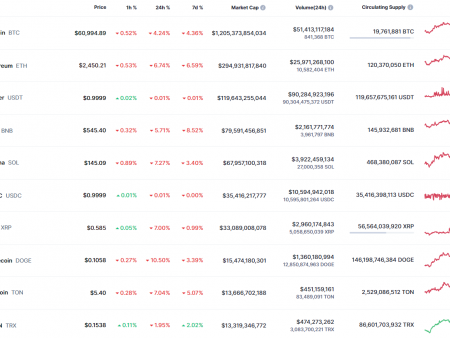
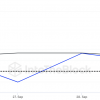
A deep dive into Solana price action reveals that the token has maintained a bullish stance, trading comfortably around the $170 mark. The key to SOL’s strength lies in its support levels; the most immediate is around the $150 range. This level has been tested several times and has held firm, indicating a solid foundation of investor confidence and a potential springboard for further bullish moves.
On the resistance front, SOL faces its next challenge at the $180 level, where it had previously encountered selling pressure. A breakout beyond this resistance could signal a continuation of the uptrend, while a failure could lead to a consolidation phase.
Additionally, Solana’s unique position in the market, with its high yield and growing ecosystem, makes it an attractive option for investors looking for alternatives during market corrections in other large-cap assets. This interest is reflected on the price chart as Solana continues to make higher lows, a classic sign of a strong uptrend.
XRP revisits painful threshold
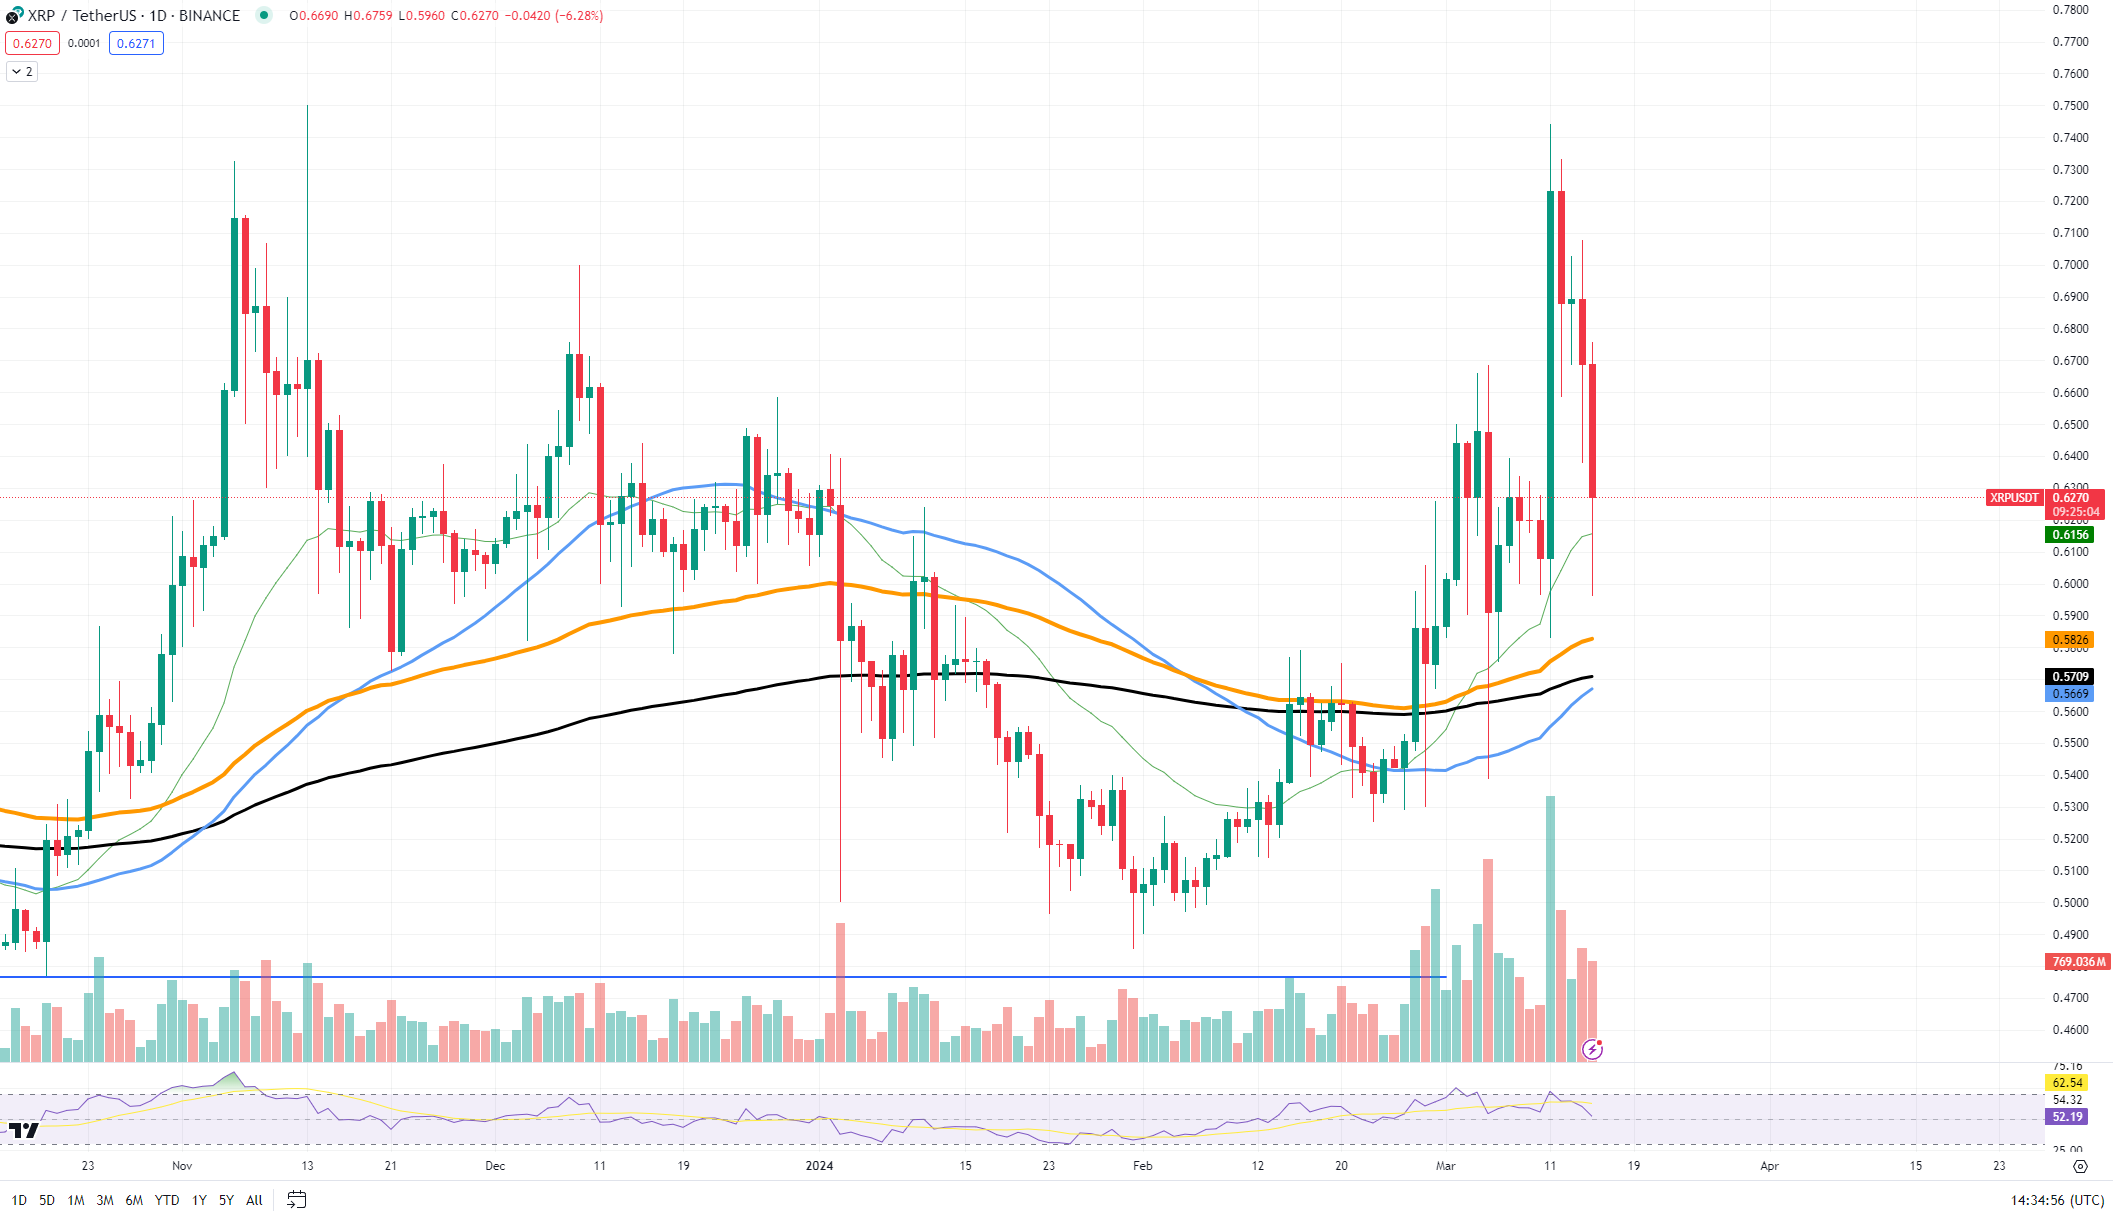
XRP has revised a price of 2023 levels and unfortunately, it is not a good thing at the moment.
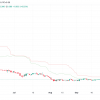
Current technical analysis of XRP charts reveals that the asset has retreated to key levels previously observed in the year 2023. According to the latest data, XRP has found local support at the $0.50 mark, a critical juncture that could determine its short term. behavior term. This level has historical significance as it has acted as support and resistance in the past, suggesting its potential to influence future price movements.
The recent drop has been cushioned by the 100-day moving average, which XRP is currently testing. A bounce off this moving average could initiate a price reversal, signaling a possible end to the current downtrend. On the other hand, a break below this moving average could result in a fresh decline, with the next support zone near the $0.47 region.
Resistance levels are now set at around $0.58, where XRP has struggled to break through in the past. A convincing move above this resistance would be necessary for the asset to regain higher prices and possibly re-establish an uptrend.
Given the market volatility, XRP’s rapid pullback to its 2023 price levels warrants attention to the possibility of a reversal. If buying pressure increases at the current support level, the token could well experience a resurgence.