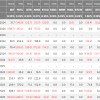
Price Analysis 11/20: SPX, DXY, BTC, ETH, BNB, XRP, SOL, ADA, DOGE, LINK
The weakness of the US Dollar Index suggests that risk assets such as Bitcoin and the S&P 500 Index may continue to enjoy favor with buyers.

Price analysis
The S&P 500 Index (SPX) rose 2.24% last week, its third consecutive weekly gain. In comparison, Bitcoin (BTC) managed a minuscule 0.8% gain, indicating consolidation below $38,000. The outlook for risk assets remains bullish as the US Dollar Index has started to decline.
Cryptocurrency investors have not offloaded their Bitcoin holdings even after the 125% rally in 2023, indicating their long-term bullish view. Reflexivity co-founder William Clemente posted a chart coming from Glassnode on X (formerly Twitter), showing that 70% of Bitcoin in circulation was not sold or transferred over the past year.
Investors have also increased their exposure to global cryptocurrency exchange-traded products (ETPs) in 2023, according to a report from digital asset platform Fineqia, seen by Cointelegraph. Fineqia reported that ETP crypto assets under management soared by 91% between January 1 and October 31, 2023.
If Bitcoin fails to overcome its resistance, will it initiate a deeper correction? Will altcoins also go down or could they buck the trend? Let’s analyze the graphs to find out.
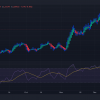
S&P 500 Index Price Analysis
The S&P 500 index surpassed the downtrend line on November 14, signaling the end of the corrective phase.
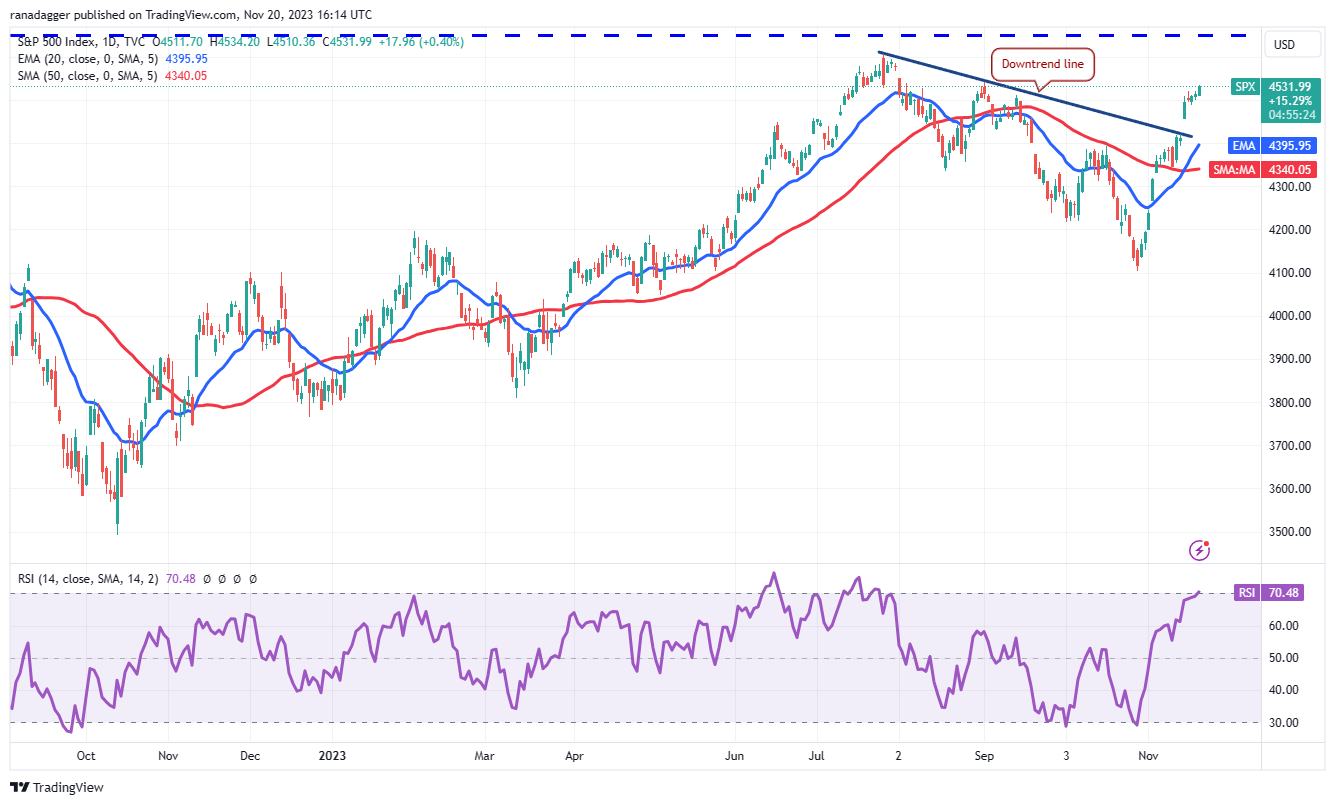
The moving averages have completed a bullish crossover and the Relative Strength Index (RSI) is in overbought territory, indicating that the bulls are in control. There is minor resistance in the 4,512 to 4,541 area, which may result in a pullback.
On the downside, the 20-day exponential moving average (4,395) is likely to act as strong support. If the price bounces off this level, it will suggest that the trend has turned positive. That will improve prospects for a rally to 4,650.
Conversely, if the 20-day EMA gives way, the index could fall to the 50-day simple moving average (4,340). Sellers will have to push the price below this support to indicate strength.
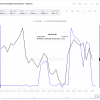
US Dollar Index Price Analysis
The US Dollar Index turned down from the 20-day EMA (105) on November 14 and fell below the descending channel pattern.
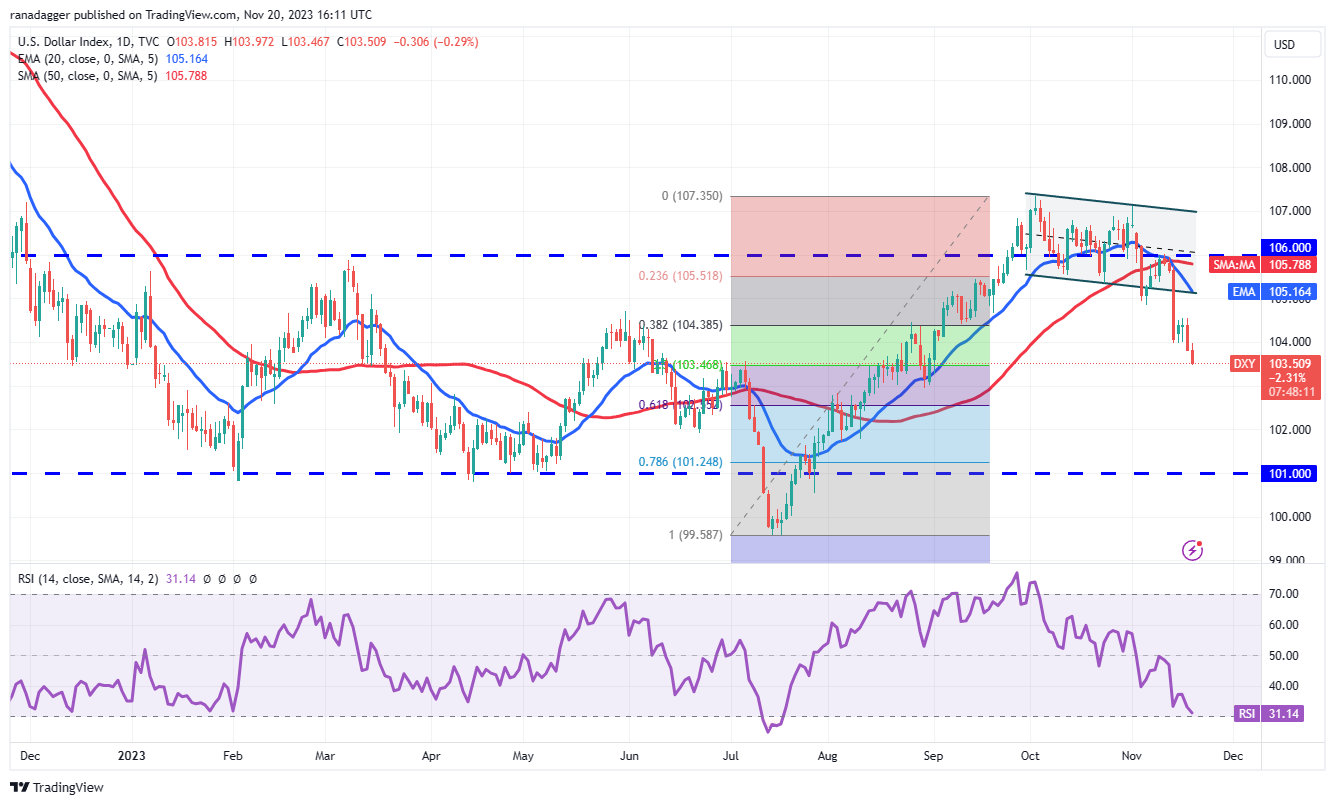
That started a correction, which reached the 50% Fibonacci retracement level of 103.46. The 20-day EMA has started to turn lower and the RSI is close to the oversold zone, indicating that the bears are in control.
If the 103.46 level is broken, the decline may extend to the 61.8% Fibonacci retracement level of 102.55. Buyers are likely to strongly defend the area between 103.46 and 102.55. The first sign of strength will be a break and close above the 20-day EMA.
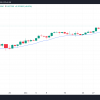
Bitcoin price analysis
After finding support at the 20-day EMA ($35,925), Bitcoin has been gradually advancing towards the vital resistance of $38,000. The bears have defended this level twice in the past; They will try to do the same one more time.
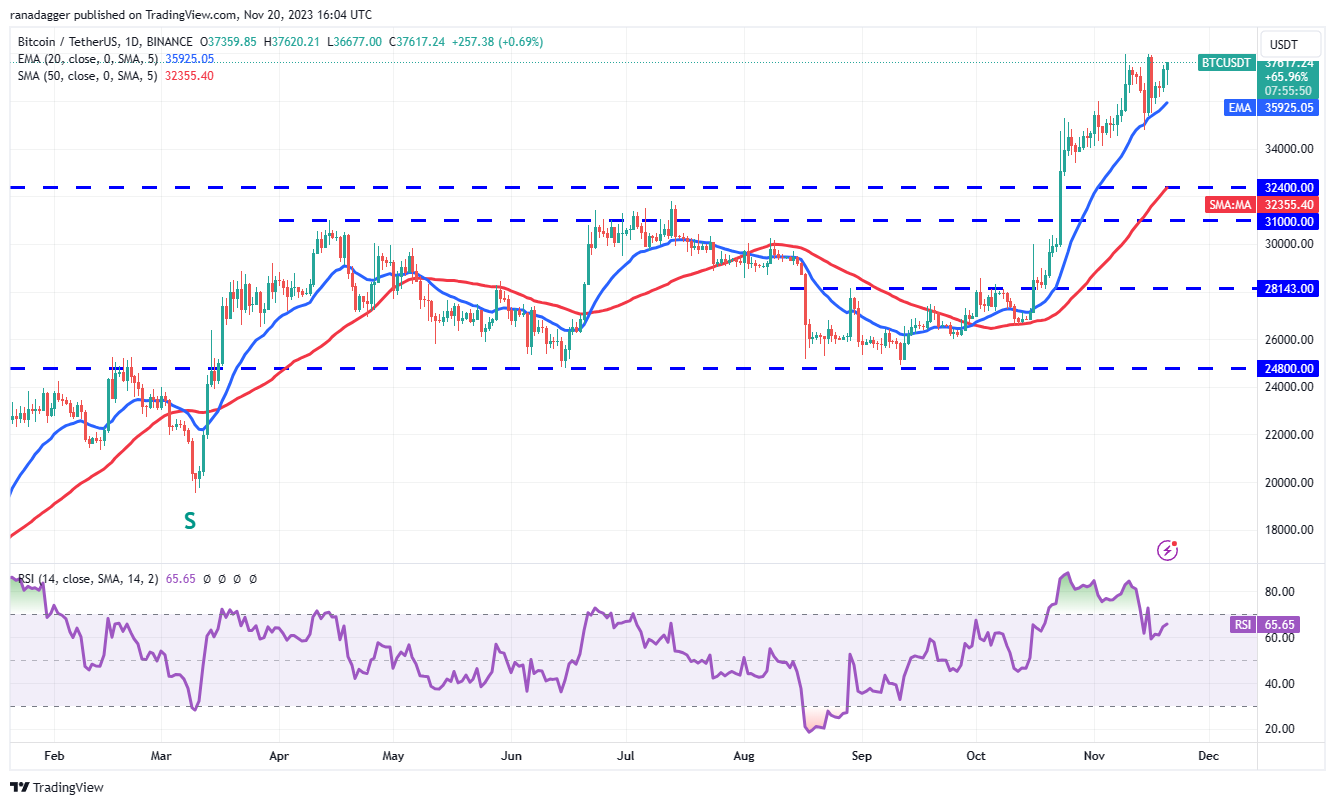
If the price drops sharply from the overhead resistance and falls below the 20-day EMA, it may trigger stops from several traders in the short term. That may start a correction in the BTC/USDT pair, which could reach $34,000 and subsequently $32,400.
On the contrary, if the bulls pierce the resistance at $38,000, it will signal the beginning of the next leg of the uptrend. The pair may reach $40,000, which again will likely act as significant resistance. The ascending moving averages and the RSI in positive territory indicate that the path of least resistance is to the upside.
Ether Price Analysis
Ether (ETH) has been forming a large ascending triangle pattern, which will complete on a breakout and close above $2,200. This bullish setup has a target of $3,400.
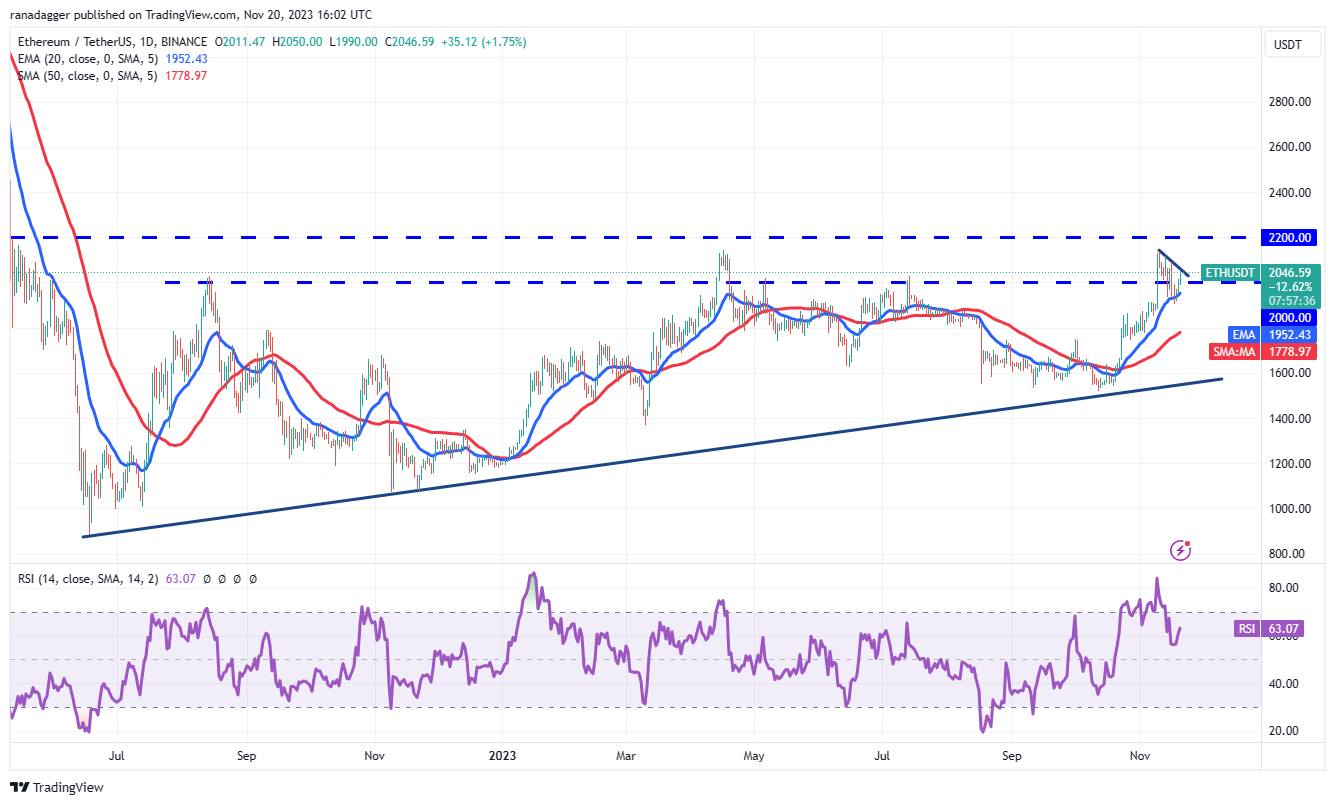
The bulls are buying the dips to the 20-day EMA ($1,949), indicating that lower levels continue to attract buyers. If the price stays above the psychological level of $2000, the ETH/USDT pair could try to rise to $2090 and then $2200.
On the other hand, if the price declines and falls below the 20-day EMA, it will indicate that the bears are trying to make a comeback in the short term. Then, the pair may fall to the 50-day SMA ($1,779).
BNB Price Analysis
The bulls have successfully held BNB (BNB) above the 20-day EMA ($242) for the past few days, indicating that sentiment remains positive and traders are buying on the dips.
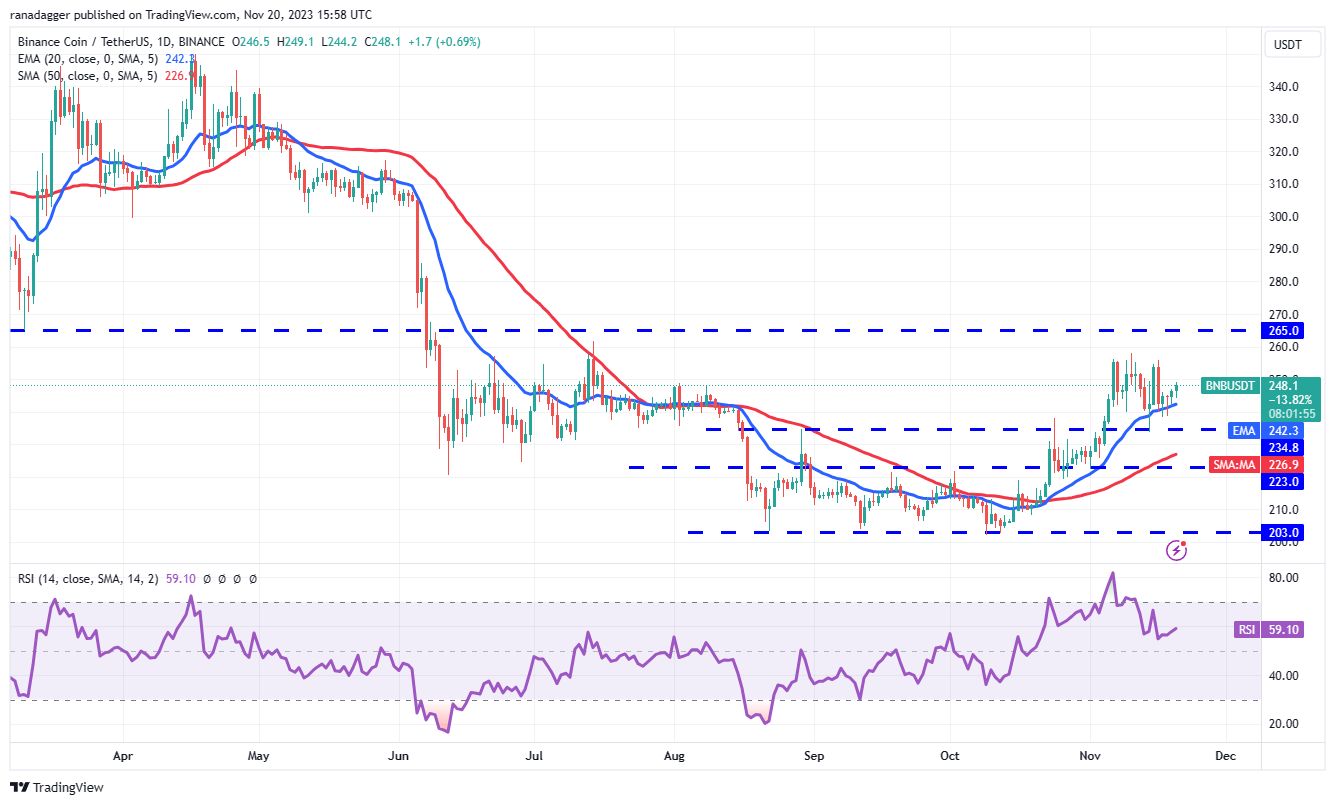
Next, the bulls will try to push the price above $258 and retest the formidable resistance at $265. A breakout and close above this level will complete a rounded bottom pattern. The BNB/USDT pair can then rise to $305 as there is no major resistance level in between.
Alternatively, if the price turns lower and falls below the 20-day EMA, it will suggest that the bulls are losing control. The pair could fall to the immediate support of $235. This level is likely to act as solid support, but if it breaks, the correction could extend to the 50-day SMA ($227).
XRP Price Analysis
XRP (XRP) fell below the 20-day EMA ($0.62) on November 16, but the bears failed to push the price to the next support at $0.56. This suggests that lower levels are attracting buyers.
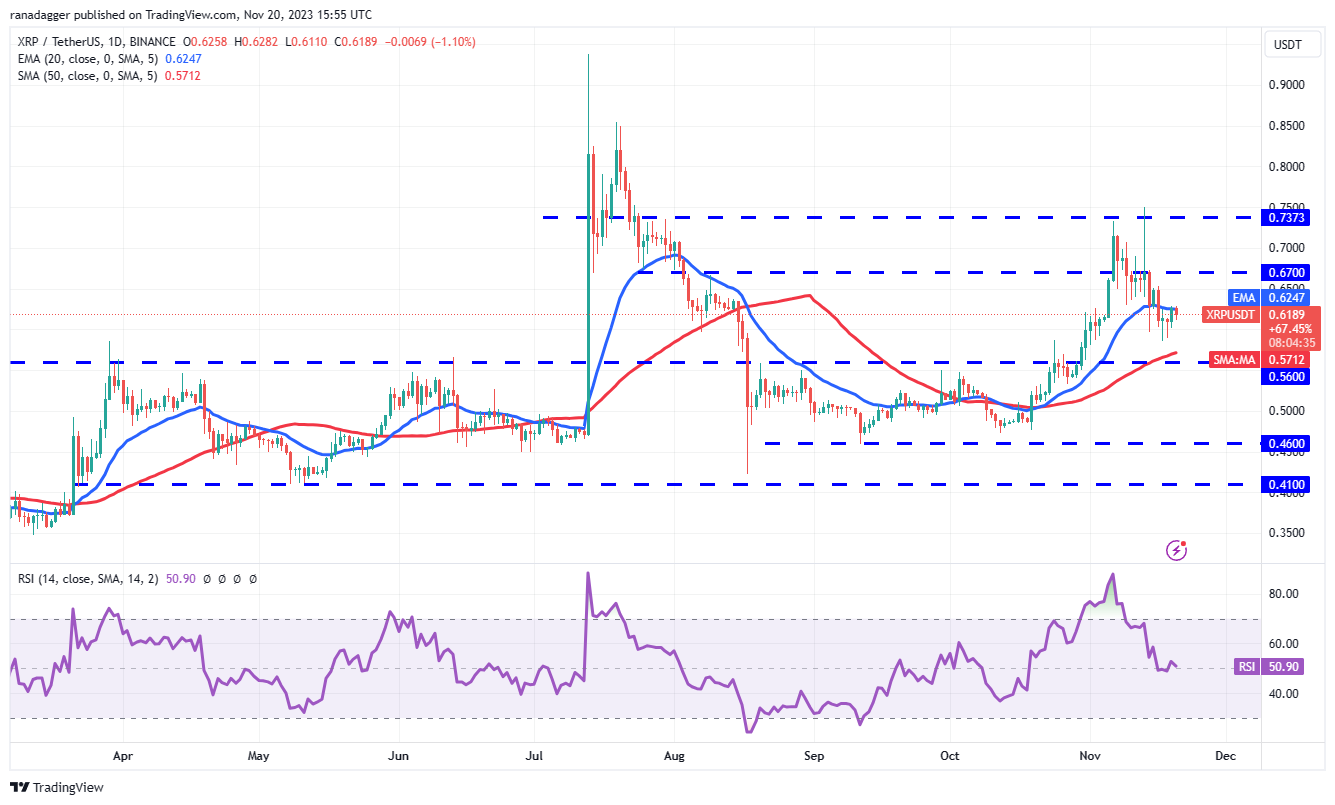
The XRP/USDT pair is stuck between $0.74 and $0.56. If buyers push and sustain the price above the 20-day EMA, it will suggest that a relief rally has begun. The pair may then rise to $0.67 and then to $0.74. Price action within the range is likely to remain random and volatile.
A break above $0.74 or a collapse below $0.56 could start a trend move. If the price stays above $0.74, the pair may jump to $0.85. On the other hand, a drop below $0.56 could sink the pair to $0.46.
Solana Price Analysis
Buyers are fighting to hold Solana (SOL) above $59, indicating that the bears remain active at higher levels.
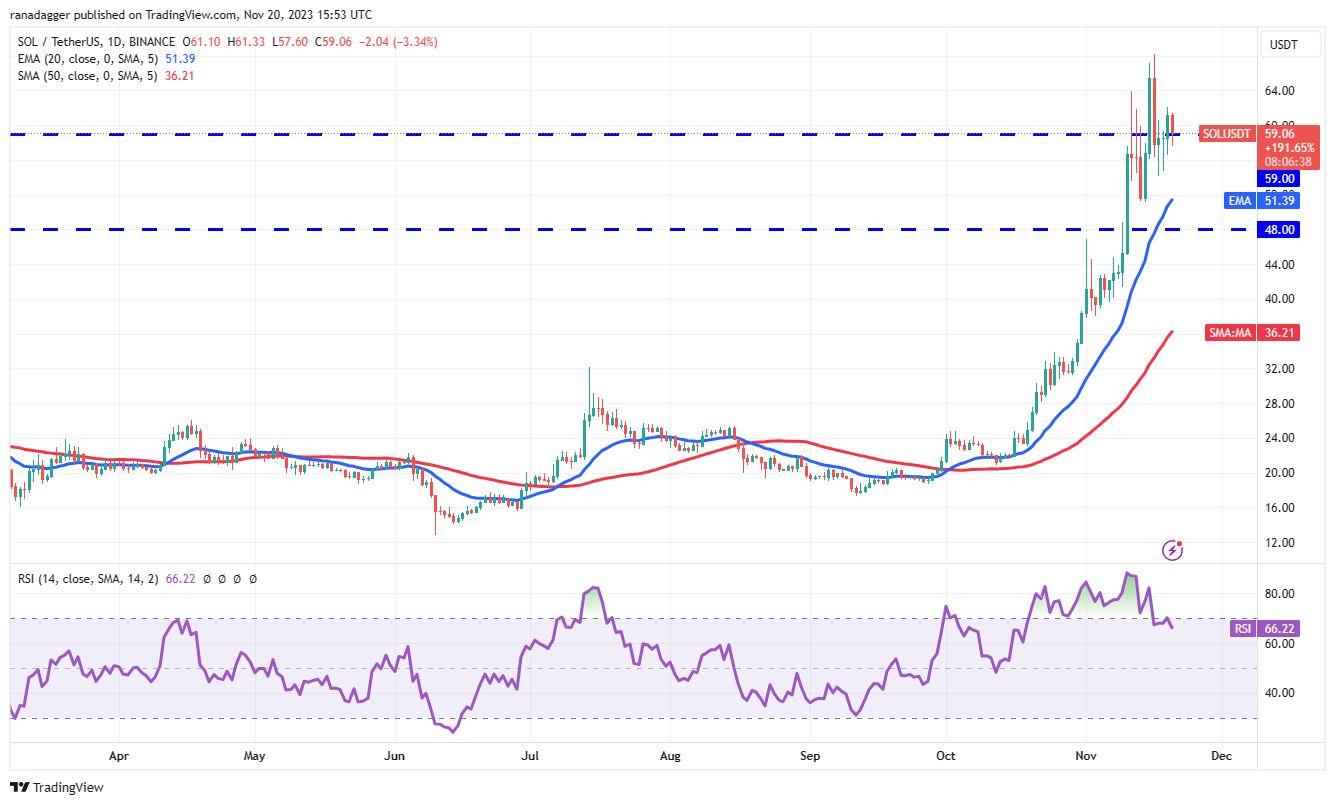
One small positive in favor of the bulls is that they have not given up much ground to the bears. This suggests that buyers are not exiting their positions quickly because they anticipate the uptrend will continue. On the upside, a break and close above $68.20 could clear the way for a rally to $77.
This bullish view will be invalidated in the short term if the price turns down and slides below the 20-day EMA ($51.39). The SOL/USDT pair could fall to the crucial support of $48.
Related: ARK and 21Shares Update Bitcoin ETF Application as Next SEC Deadline Approaches
Cardano Price Analysis
Cardano (ADA) has been witnessing a tough battle between the bulls and bears near the $0.38 level for the past few days.
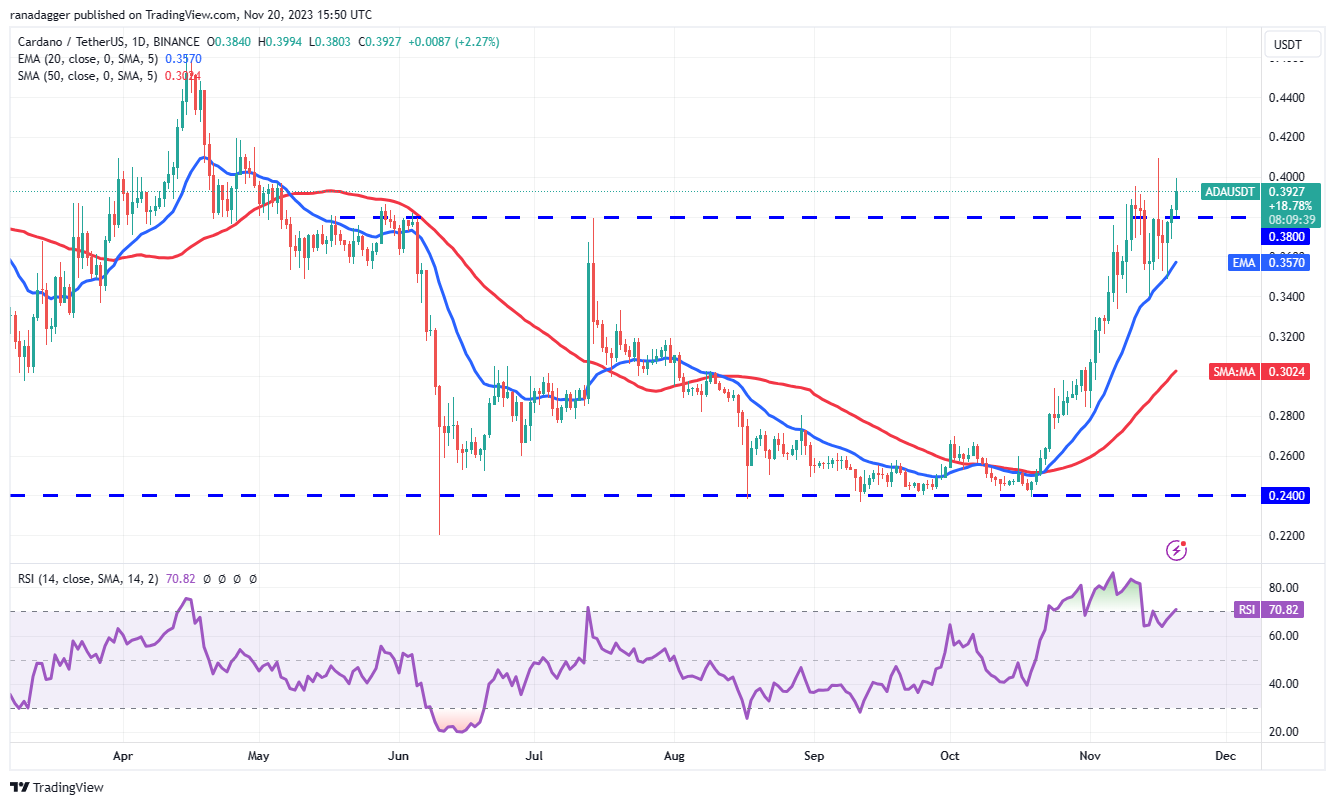
The ascending moving averages and the RSI in the overbought zone indicate that the bulls have the upper hand. If the price stays above the $0.38 to $0.40 resistance zone, the ADA/USDT pair could rise to $0.46.
If the bulls want to avoid the rise, they will have to quickly drag the price below the 20-day EMA ($0.35). If that happens, several short-term bulls may take profits and the pair could fall to the 50-day SMA ($0.30).
Dogecoin Price Analysis
Dogecoin (DOGE) has been gradually rising in recent days. The bulls took the price above $0.08 on November 17, but were unable to sustain the breakout.
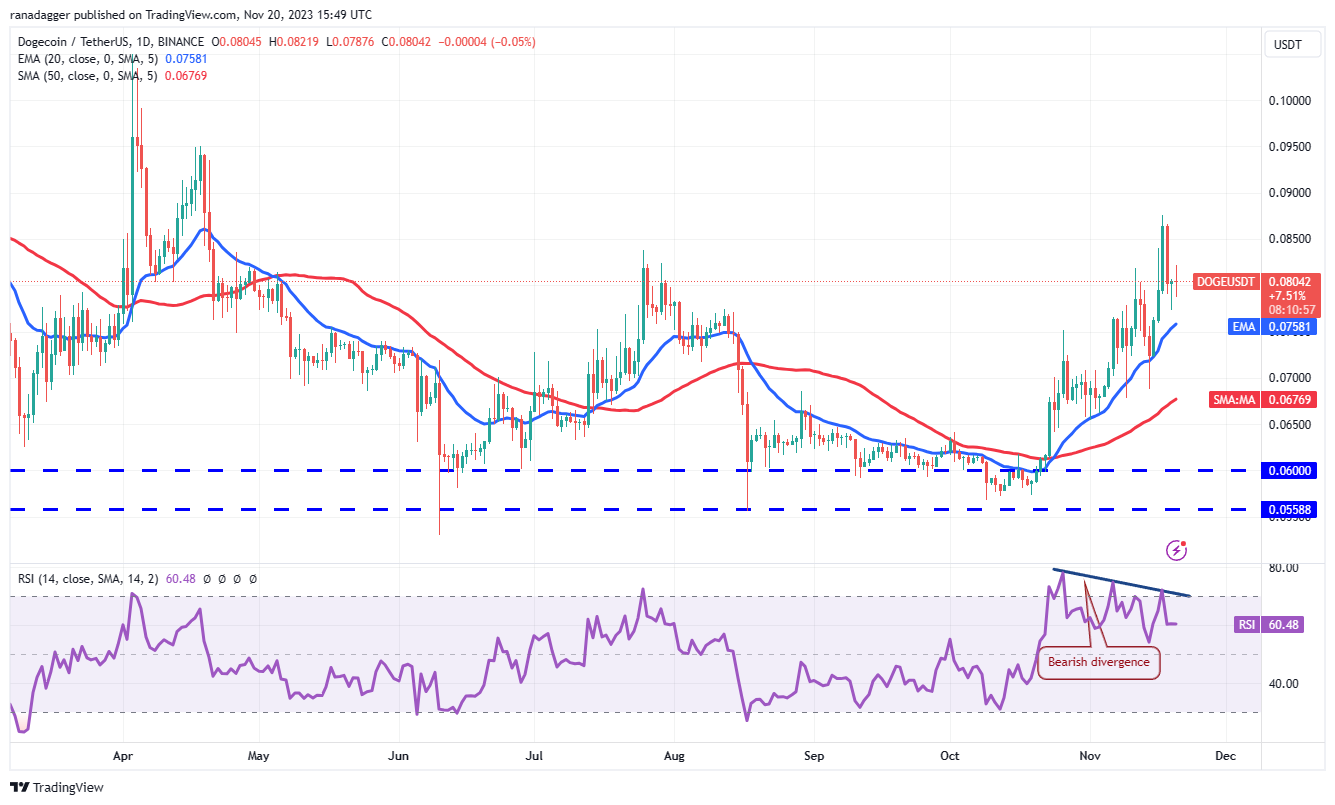
The price dropped on November 18 and fell to $0.08. A positive sign is that the bulls are trying to defend the $0.08 level. If they manage to do so, it will indicate that $0.08 has become support. This will improve the prospects for resumption of the uptrend. The DOGE/USDT pair could then reach $0.10.
The RSI is showing signs of forming a bearish divergence, indicating that momentum may be slowing. Sellers will have to pull and hold the price below the 20-day EMA ($0.07) to take control.
Chain price analysis
Sellers attempted to sink Chainlink (LINK) below the 20-day EMA ($13.64) on November 17 and 18, but the long tail of the candle indicates solid buying at lower levels.
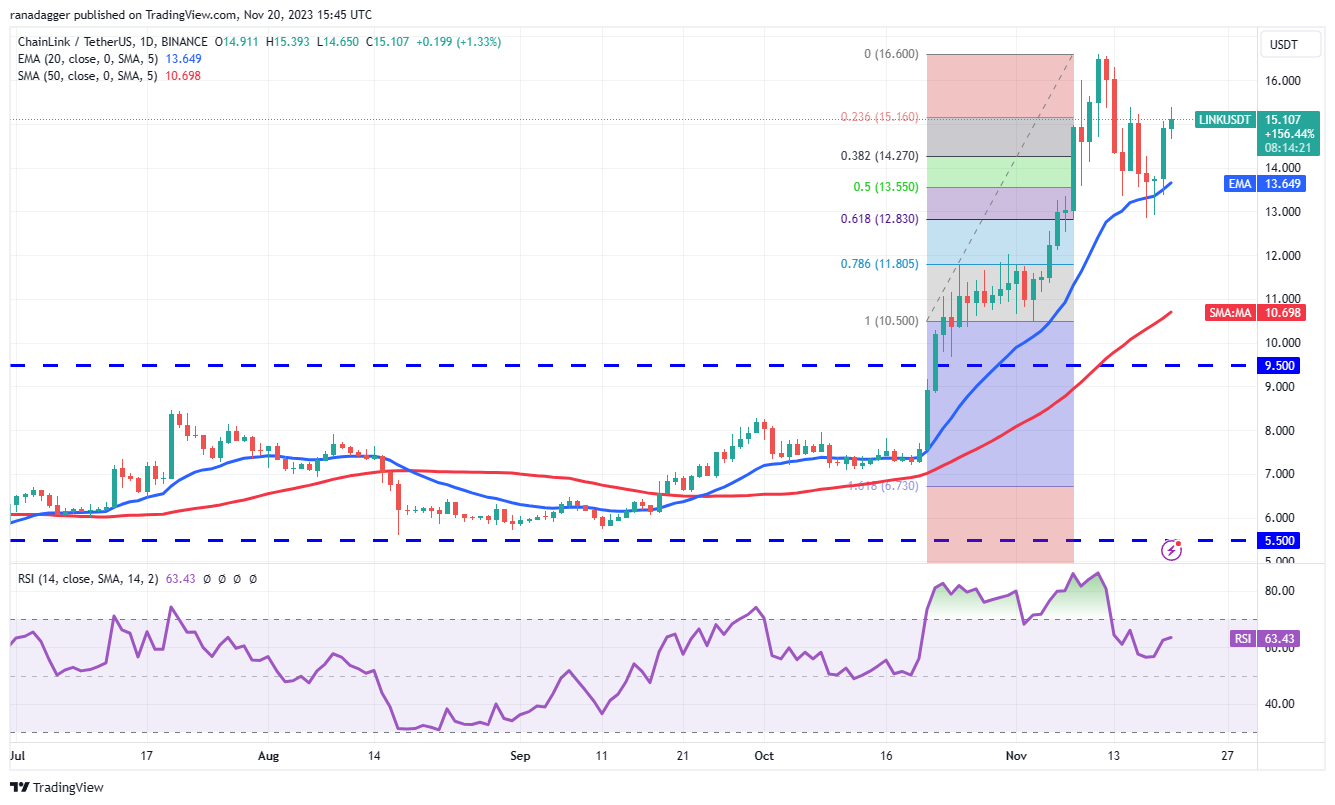
There is minor resistance at $15.40, but if this level is scaled, the LINK/USDT pair could retest the local high at $16.60. Sellers are again expected to mount a vigorous defense at this level, but if the bulls do not give up much ground, the probability of a break above $16.60 will increase.
On the contrary, if the price drops below $15.40, it will suggest that the bears are selling at higher levels. The trend will change in favor of the bears if they can sink and sustain the price below the 61.8% Fibonacci retracement level of $12.83.
This article does not contain investment advice or recommendations. Every investment and trading move involves risks, and readers should conduct their own research when making a decision.
Add reaction