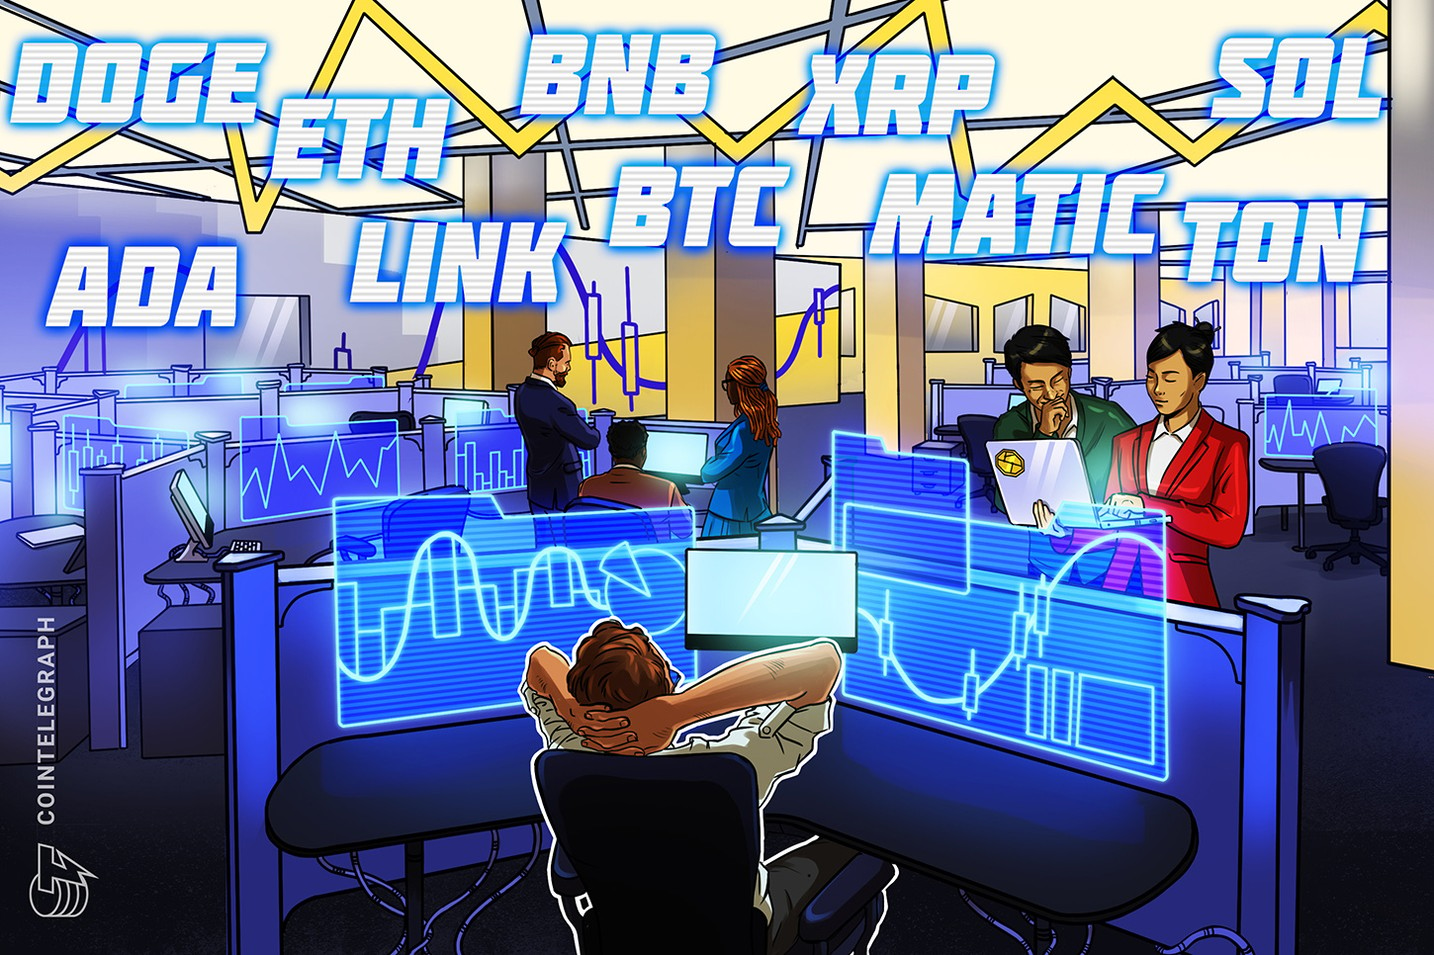
Price Analysis 11/15: BTC, ETH, BNB, XRP, SOL, ADA, DOGE, MATIC, LINK, TON
Bitcoin and some altcoins are showing strength, a possible sign that the uptrend has resumed.
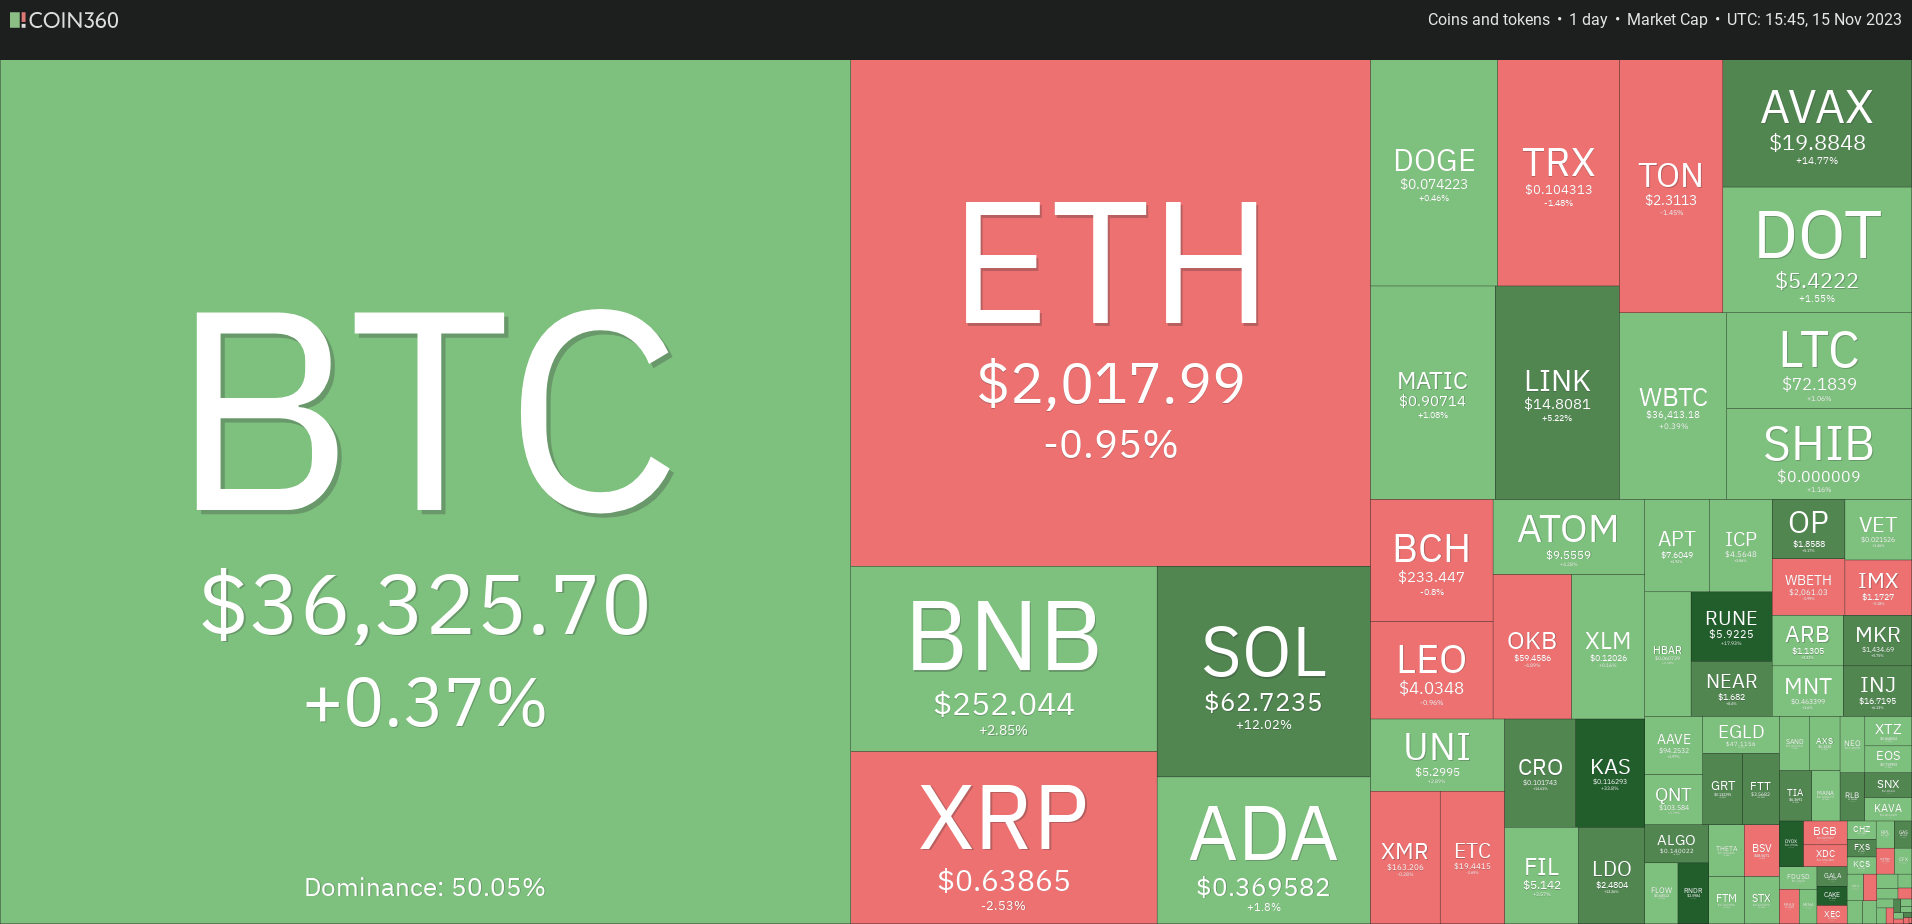
Price analysis
Bitcoin (BTC) succumbed to profit booking on November 13 and 14, pushing the price below $35,000. Corrections are a normal part of every up move and are considered healthy as they shake out weak hands and allow stronger hands to increase their positions.
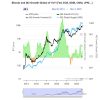
A note of caution for eager dip buyers is that Glassnode data shows that the number of whale wallets holding more than $1,000 in iBitcoin fell to its lowest level in about a month. This indicates that some whales may have sold off the recent strength.
DecenTrader co-founder Filbfilb said in an interview with Cointelegraph that a drawdown could come before the rally that would lead to Bitcoin’s halving in April 2024. Filbfilb believes Bitcoin could accelerate its pace after that and reach between $46,000 and $48,000 before the halving.
Could Bitcoin and select altcoins resume their uptrend, or will higher levels attract solid selling by bears?
Let’s analyze the charts of the top 10 cryptocurrencies to find out.
Bitcoin price analysis
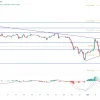
Bitcoin re-entered the ascending channel pattern on November 13, which may have trapped the aggressive bulls. That started a sell-off, which brought the price to the channel support line on November 14.
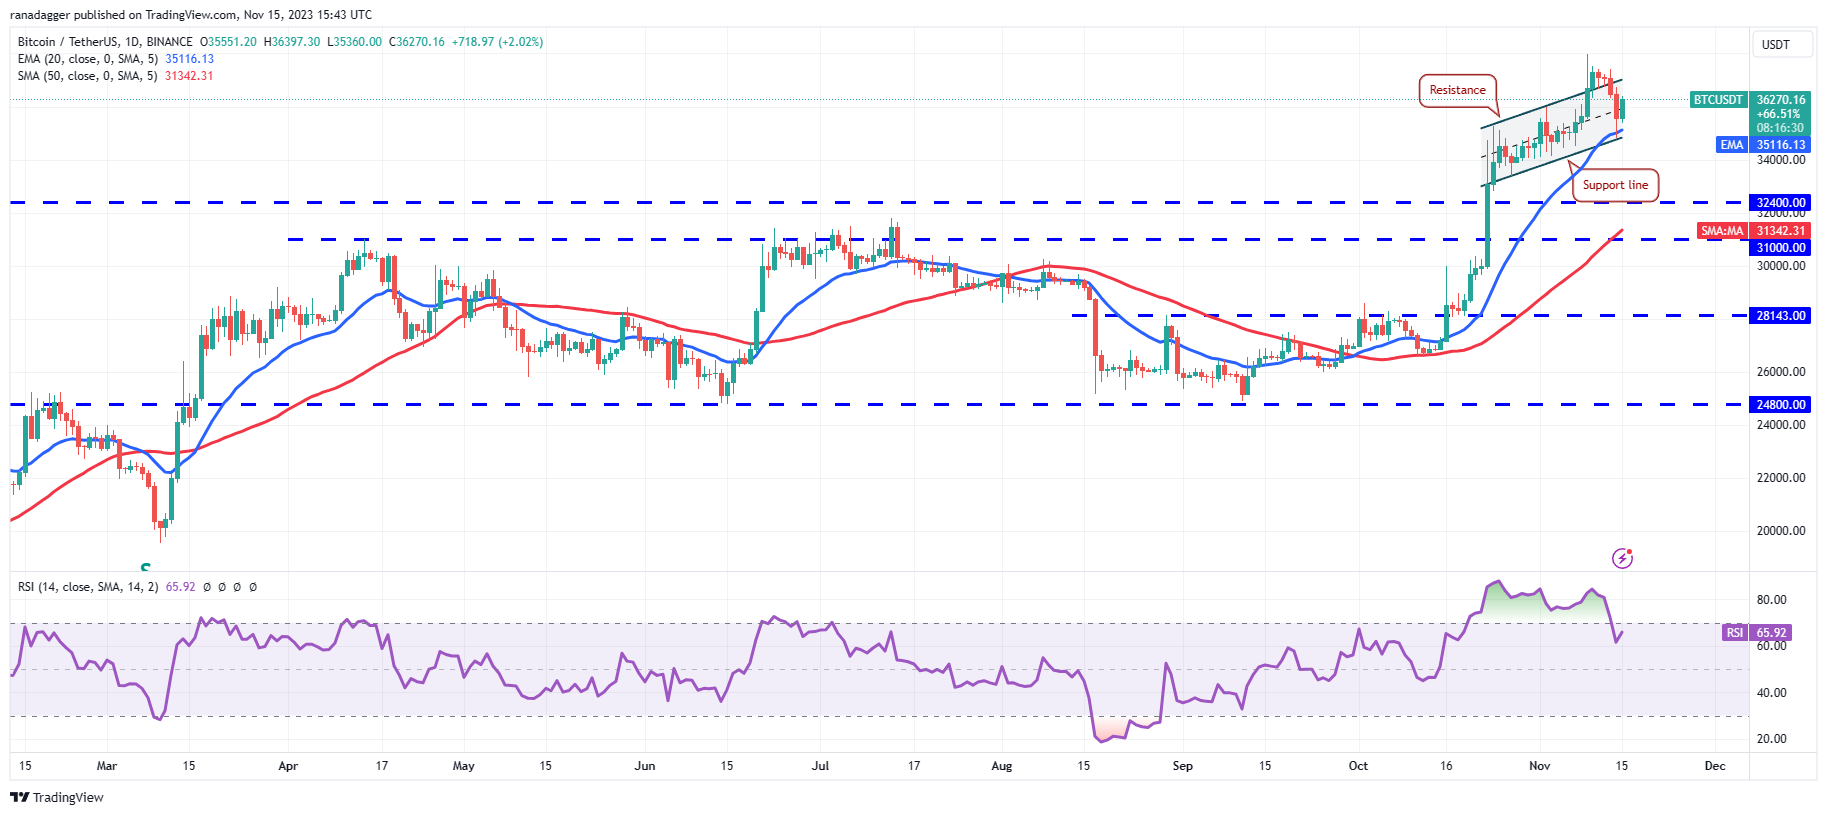
The strong bounce off the support line suggests that lower levels continue to attract buyers. The bulls will try to push the BTC/USDT pair above the resistance line, but may encounter heavy selling from the bears.
If the price turns lower and falls below the channel, it will suggest that traders are rushing towards the exit. That may push the price towards the $32,400 to $31,000 support zone. The bulls are expected to buy aggressively at lower levels. The bulls will be in control again after the price breaks above $38,000.
Ether Price Analysis
Ether (ETH) rose on November 13, but the long wick on the day’s candle suggests selling at higher levels. The selling continued on November 14 and the price fell below the psychological level of $2,000.
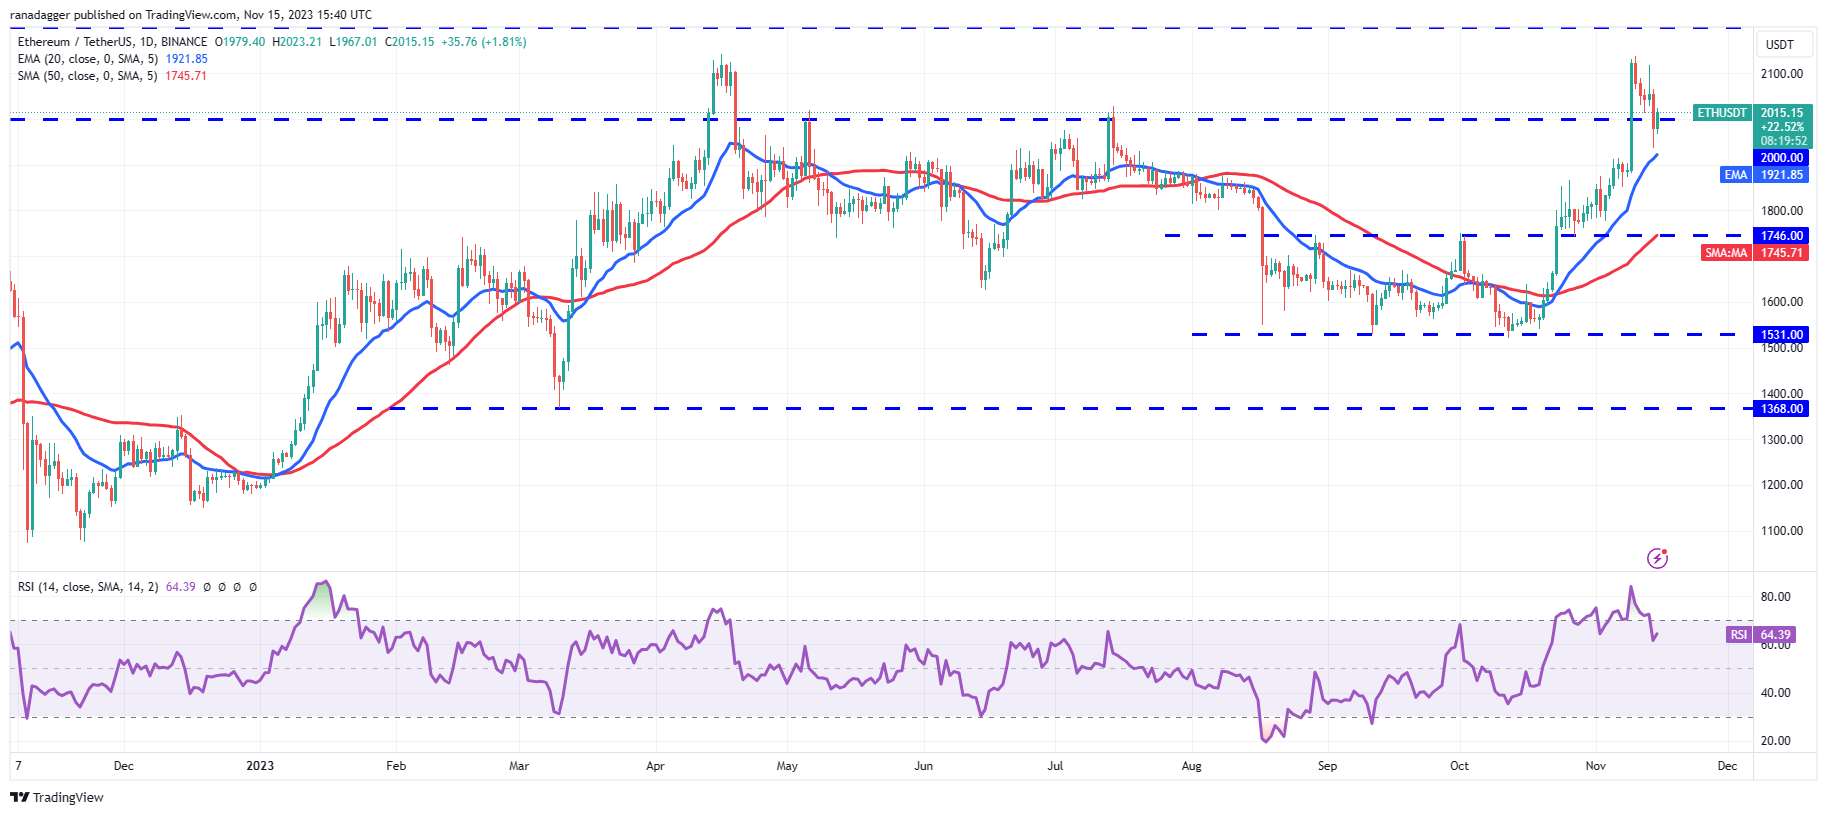
The bulls’ failure to convert the $2,000 level into support is a negative sign, but one consolation is that buyers held the 20-day exponential moving average ($1,921) lower. If buyers keep the price above $2,000, it will indicate vigorous buying at lower levels. The ETH/USDT pair may retest the upper zone between $2,137 and $2,200.
On the contrary, if the price turns lower and falls below the 20-day EMA, it will indicate that the bears are back in the game. That could clear the way for a drop to the 50-day SMA ($1,745).
BNB Price Analysis
BNB (BNB) broke below the 20-day EMA ($239) on November 14, but recovered from solid support at $235. This suggests solid buying at lower levels.
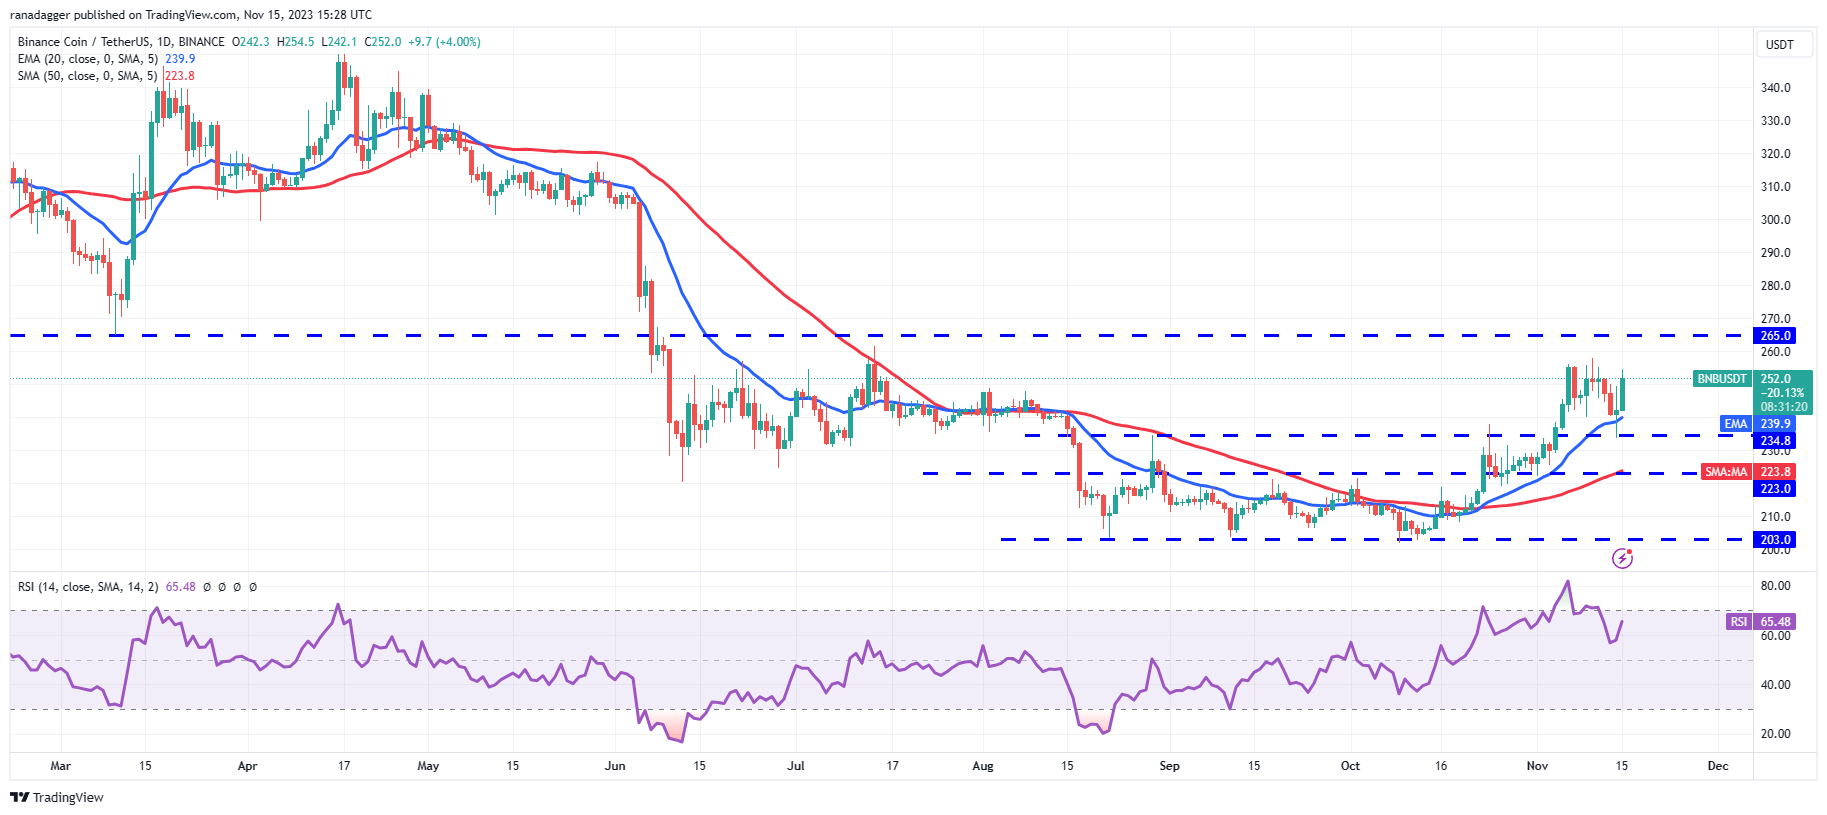
The ascending moving averages and the relative strength index (RSI) in positive territory suggest that the bulls have a slight advantage. Buyers will try to push the price to the upper resistance zone between $258 and $265.
Vendors are expected to protect this area vigorously. If the price declines sharply from $265, the BNB/USDT pair may fall to $235 and oscillate between these two levels for some time.
XRP Price Analysis
XRP (XRP) pierced the $0.74 resistance on November 13 and then declined rapidly, indicating aggressive selling at higher levels.
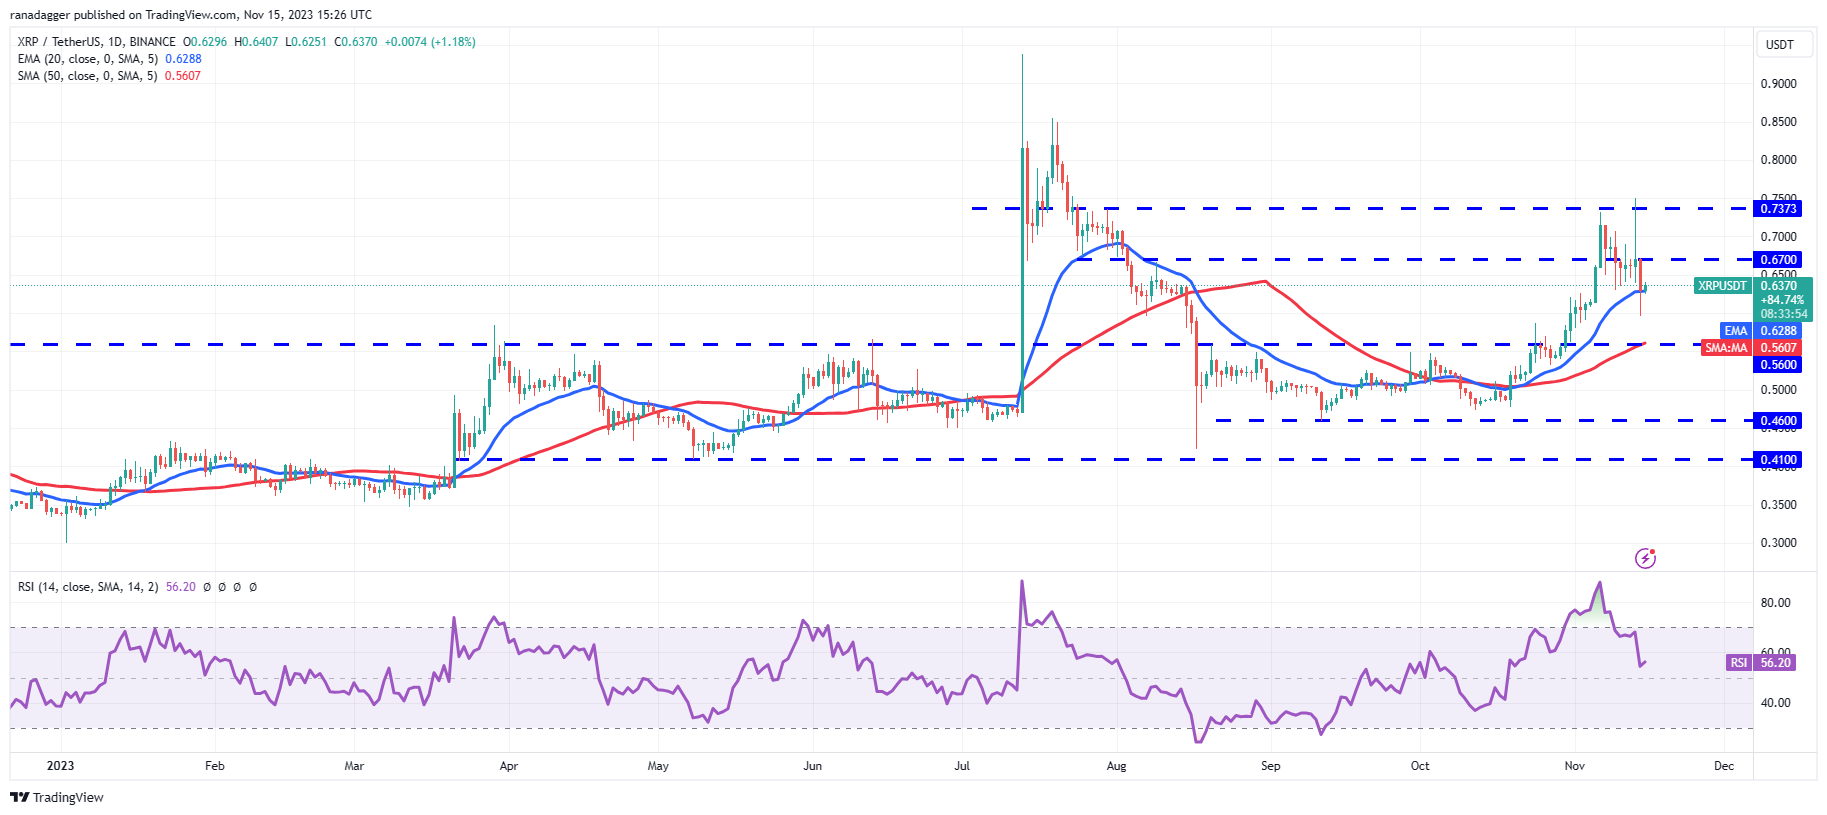
Selling continued on November 14, placing the price below the 20-day EMA ($0.62). This level is likely to witness a tough battle between bulls and bears. If the price stays below the 20-day EMA, the next stop could be the 50-day SMA ($0.56). Such a move suggests that the XRP/USDT pair may fluctuate between $0.56 and $0.74 for a while.
The bulls will take control again after pushing the price above the overhead resistance of $0.74. The pair can then rise to $0.85 and later to $1.
Solana Price Analysis
The bears attempted to initiate a correction in Solana’s SOL (SOL) on November 13, but the bulls intervened and stopped the decline to $51 on November 14.
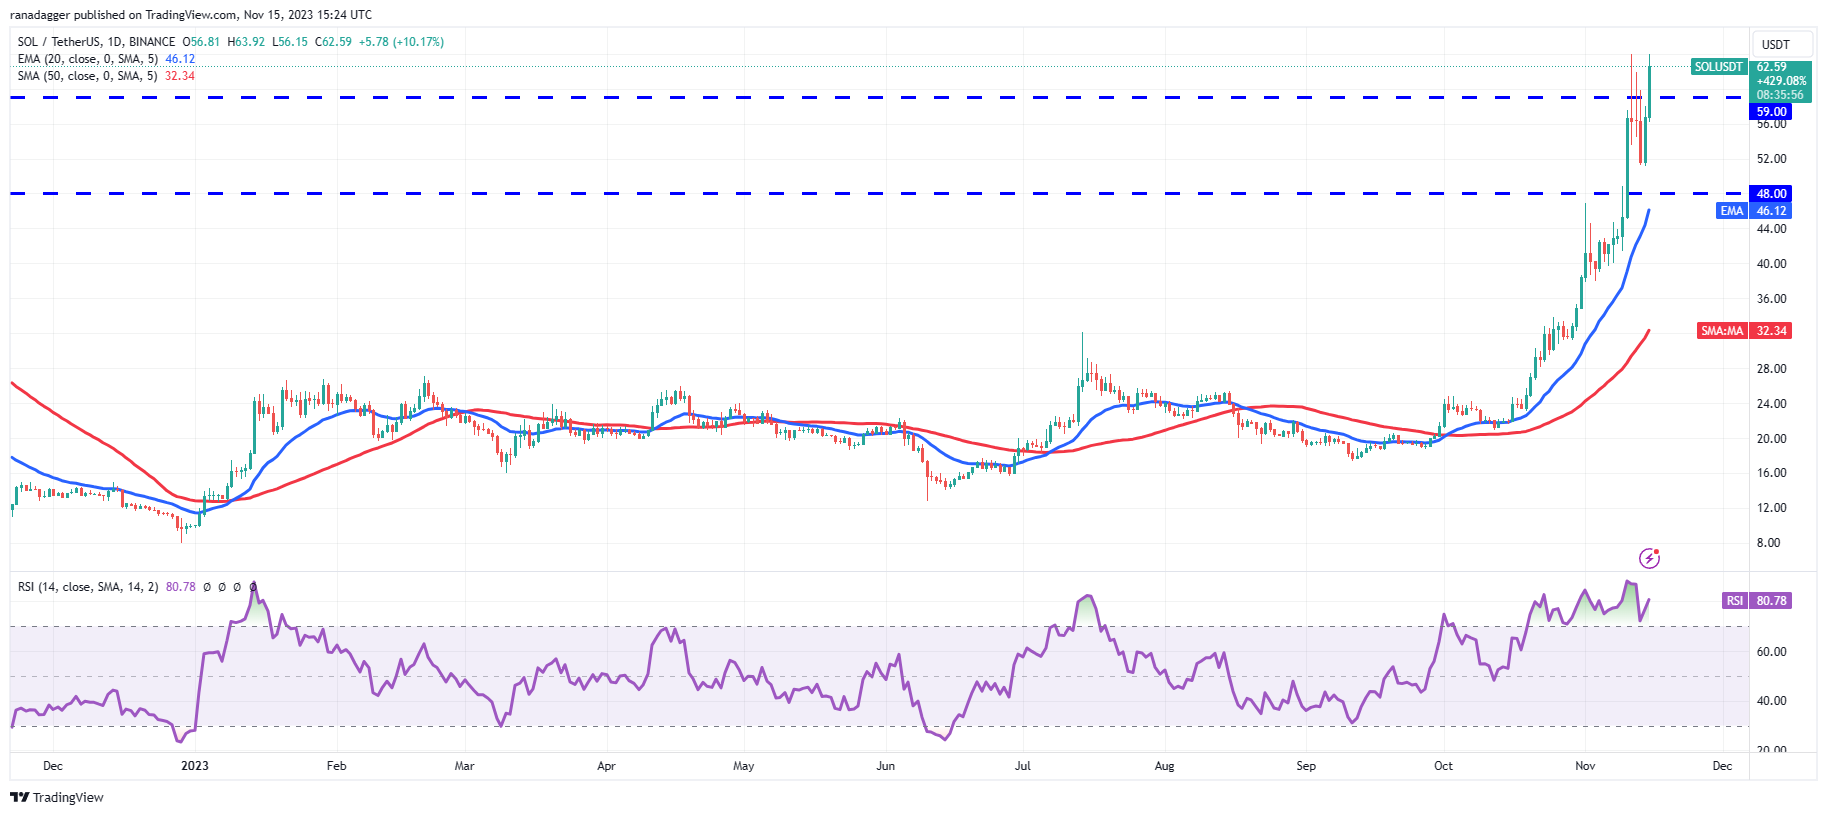
Buying continued on November 15 and the bulls are trying to break the $64 barrier. If they manage to do so, the SOL/USDT pair could begin the next leg of the uptrend. Then, the pair can rise to $77 and subsequently to $95.
The risk to the bullish move is that the RSI has been in overbought territory for the past few days. That suggests that the rally is overextended in the near term and may witness a correction or consolidation.
Cardano Price Analysis
Cardano’s ADA (ADA) remained above $0.38 from November 10 to 12, but the bulls failed to take advantage of the next leg of the uptrend. This may have tempted short-term traders to book profits, leading the price to the 20-day EMA ($0.34) on November 14.
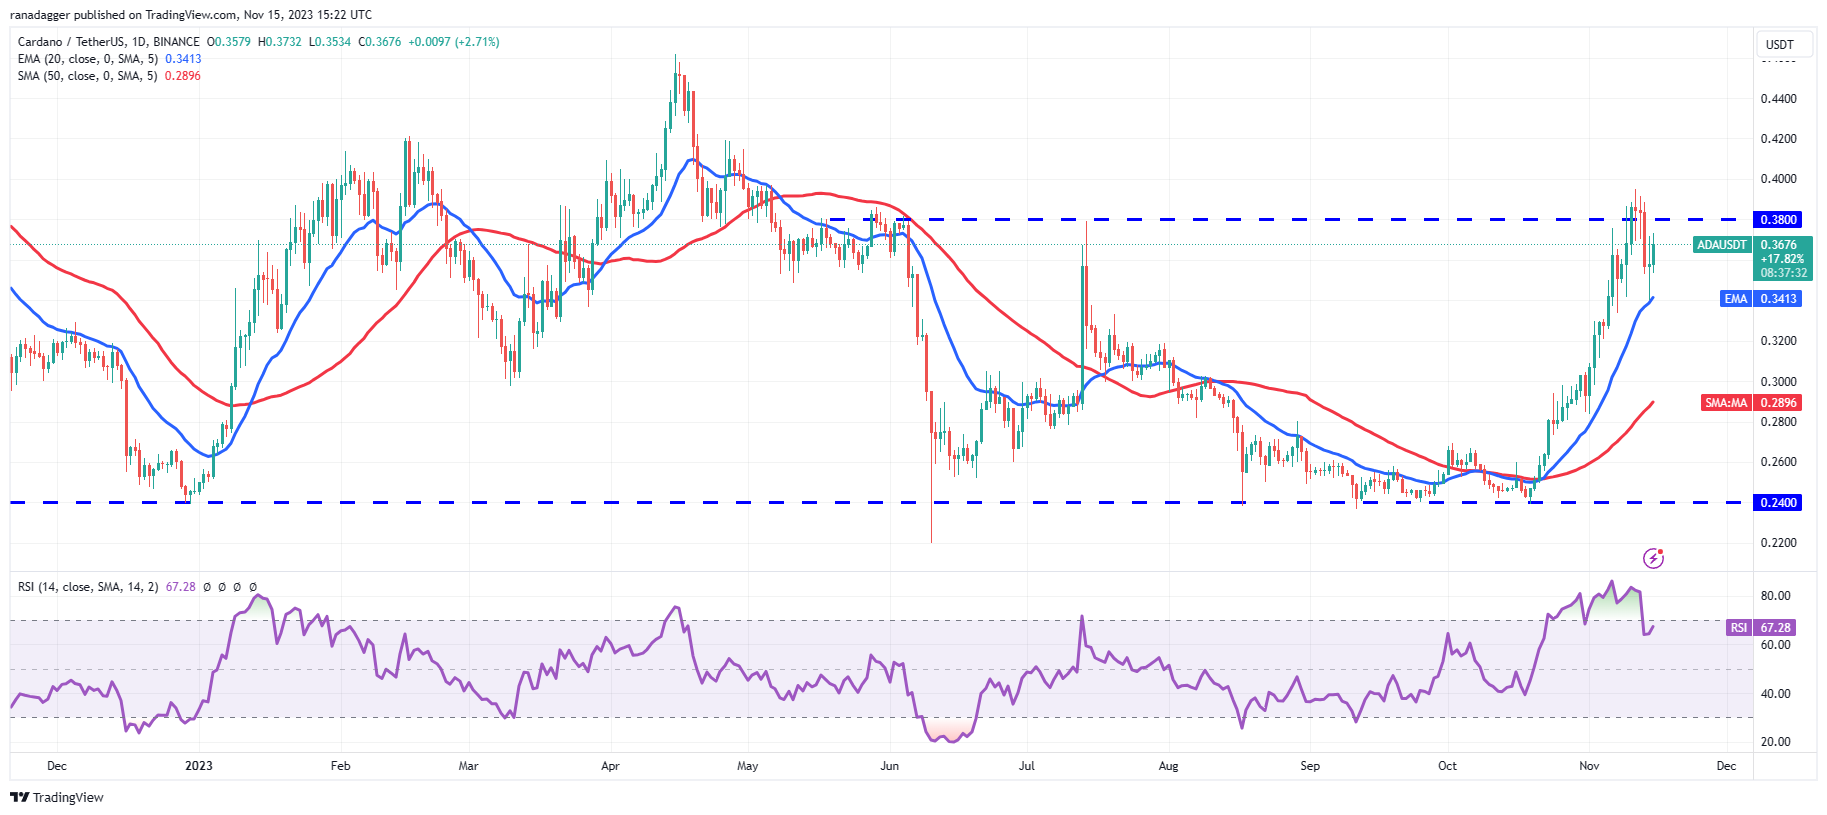
The ADA/USDT pair rebounded sharply from the 20-day EMA, as seen from the long tail of the candle. Buyers will try to push the price to the resistance zone between $0.38 and $0.39. If the bulls clear this hurdle, the pair could rise to $0.46.
On the other hand, if the price declines and falls below the 20-day EMA, the doors will open for a possible drop to $0.32. Such a move will indicate that the pair may consolidate between $0.24 and $0.38 for a few days.
Dogecoin Price Analysis
Dogecoin (DOGE) failed to hold above $0.08 on November 11 and 12, resulting in a correction to the 20-day EMA ($0.07) on November 14.
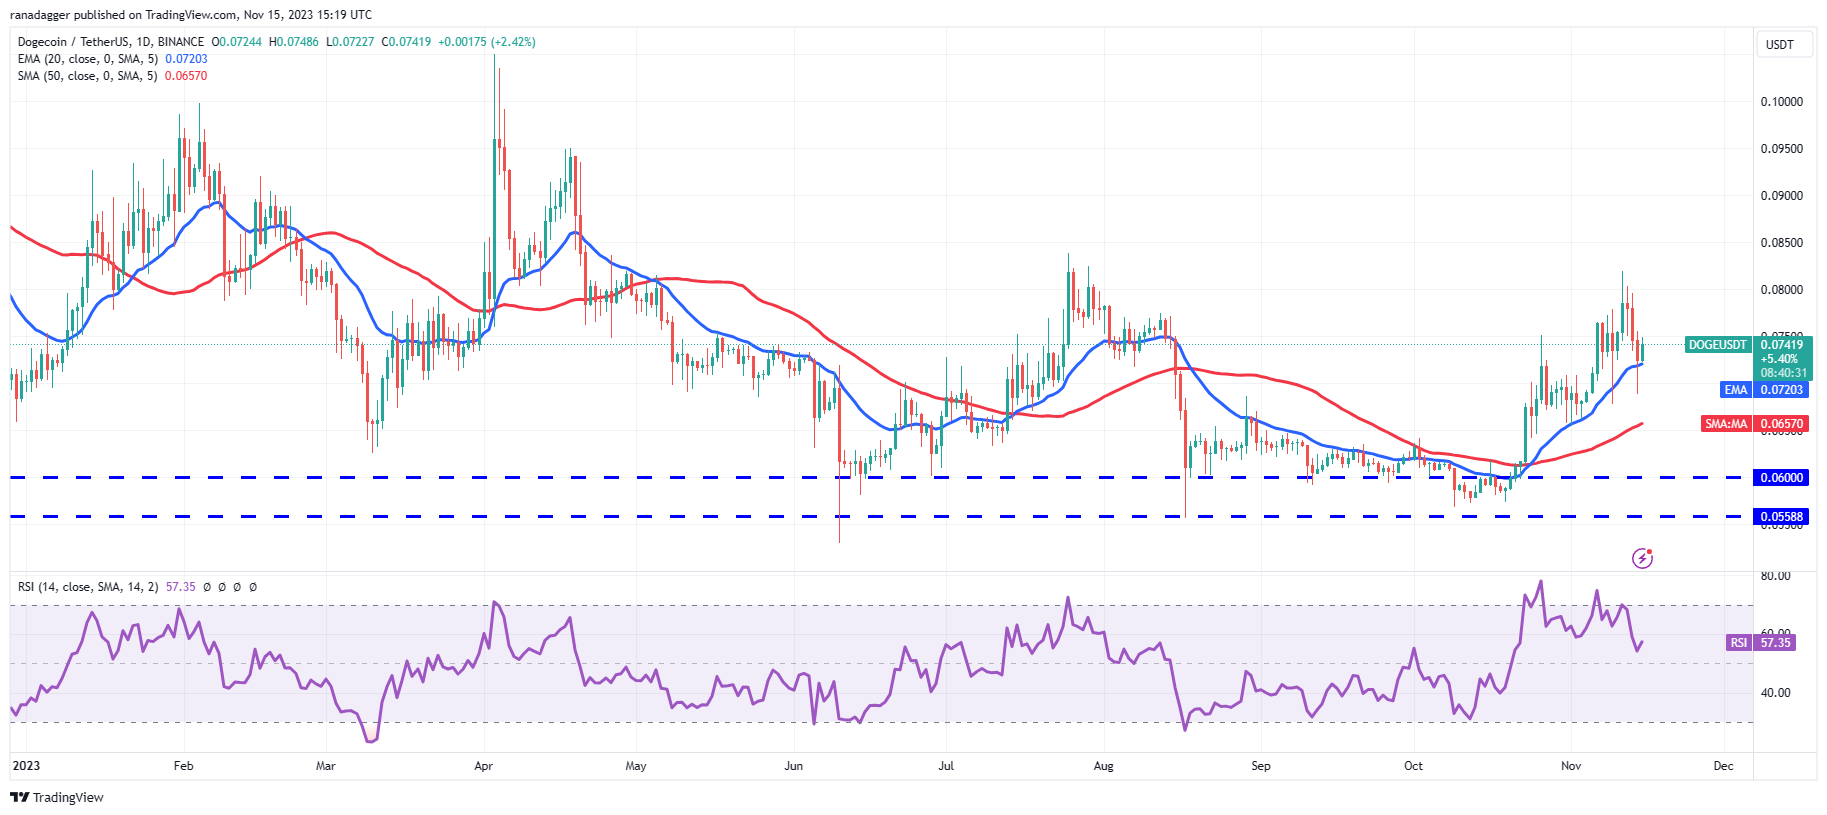
The bears pushed the price below the 20-day EMA, but the long wick of the candle shows solid buying at lower levels. The bulls will again try to push the price to $0.08, where they are likely to encounter heavy selling from the bears.
If the price turns down from $0.08 and falls below the 20-day EMA, it will indicate that the DOGE/USDT pair may remain range-bound for a while. Conversely, a break and close above $0.08 will signal the start of the next leg of the upward move to $0.10.
Related: Three reasons why Bitcoin price failed to surpass $37,000
Polygon price analysis
Polygon’s MATIC (MATIC) witnessed huge volatility on November 13 and 14, as seen in the large intraday ranges. This indicates an intense battle between bulls and bears.
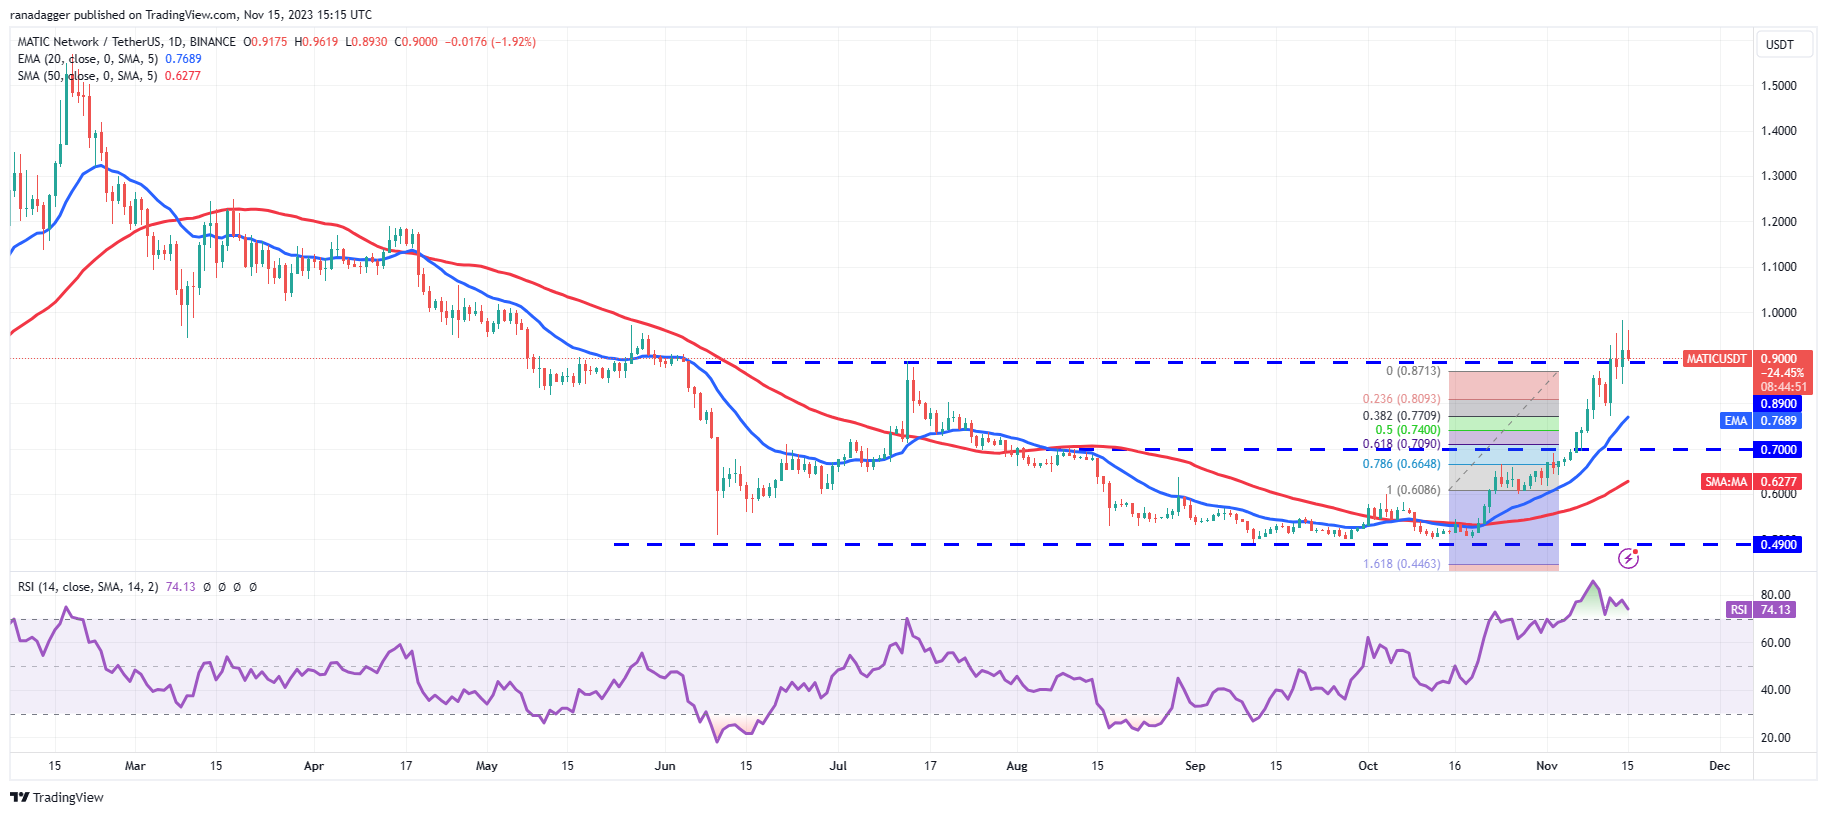
The fact that the bulls failed to hold the price below the $0.89 level suggests that the bulls are trying to convert the level into support. The bulls may once again face stiff opposition from the bears at the psychological level of $1.
If the price turns down from this level but does not fall below $0.89, the probability of the uptrend resuming will increase. Above $1, the MATIC/USDT pair could reach $1.20. On the contrary, a drop below $0.84 could initiate a correction towards the 20-day EMA ($0.77).
Chain price analysis
Chainlink’s LINK (LINK) is correcting in a strong uptrend. The price fell to the 20-day EMA ($13.16) on November 14, which will likely act as formidable support.
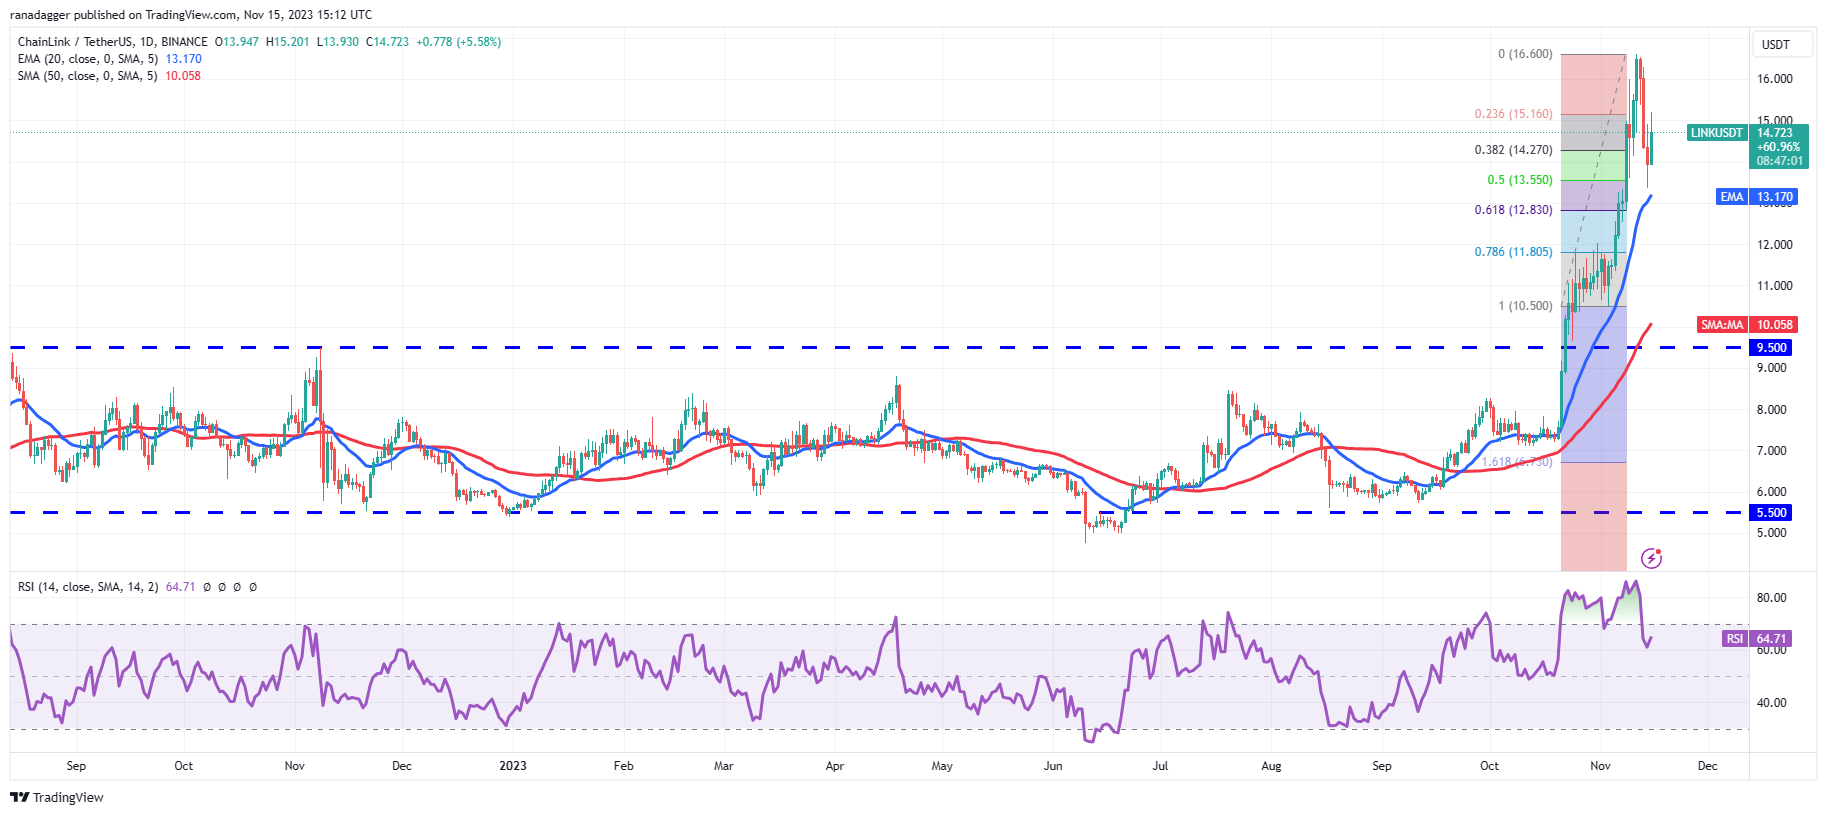
If the bounce from the 20-day EMA holds, the bulls will try to push the price to the local high of $16.60. This is a critical level to pay attention to because a break above it will signal the resumption of the uptrend. The next LINK/USDT pair could rise to $20.
Contrary to this assumption, if the price turns down from $16.60, it will suggest that the bears remain active at higher levels. That could keep the pair stuck between $16.60 and the 20-day EMA for some time.
Toncoin Price Analysis
Toncoin (TON) found support at $2.31 on November 12, but the bounce was short-lived. The price dropped and crashed below $2.31 on November 14.
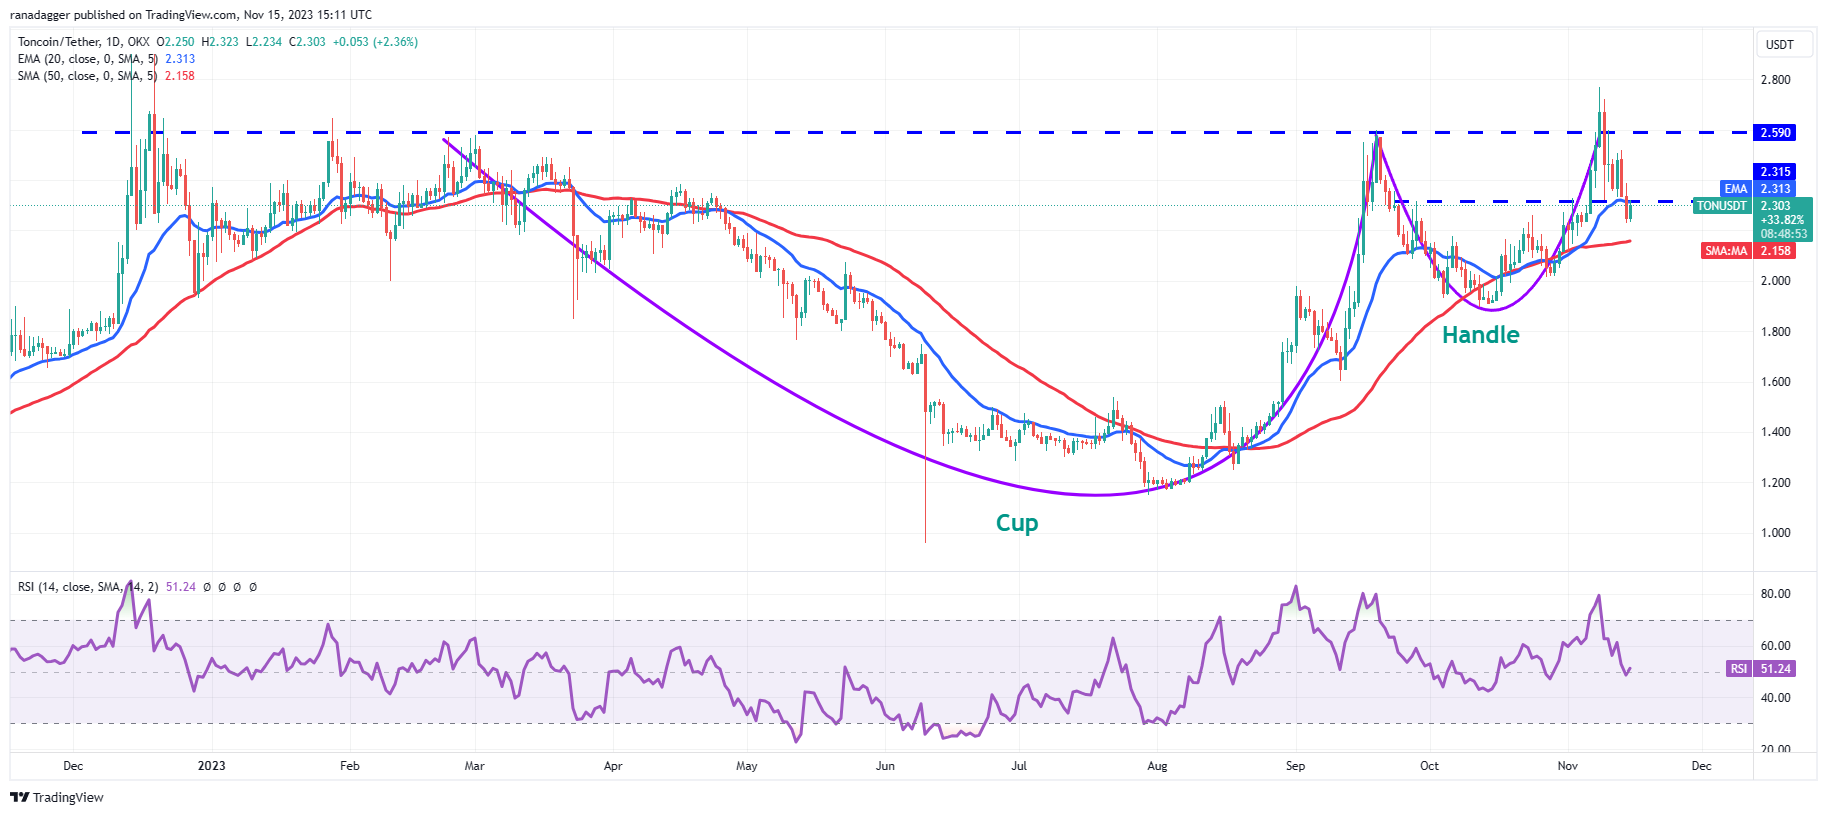
The failure of the bulls to defend the 20-day EMA ($2.31) suggests that the positive momentum is weakening. Both moving averages have stabilized and the RSI is near the midpoint, indicating range-bound action in the near term.
On the downside, if the 50-day SMA is broken, the TON/USDT pair could fall to $2 and subsequently $1.89. Buyers are expected to guard this level vigorously. The bulls will have to push the price above $2.77 to signal the start of the next leg of the upward movement.
This article does not contain investment advice or recommendations. Every investment and trading move involves risks, and readers should conduct their own research when making a decision.
Add reaction