Ethereum price corrected the increase and tested the support at $2,400. ETH is now consolidating and could be looking for fresh gains above the $2,465 resistance.
- Ethereum began a downward correction below the $2,500 zone.
- The price is trading just above $2,430 and the 100-hour simple moving average.
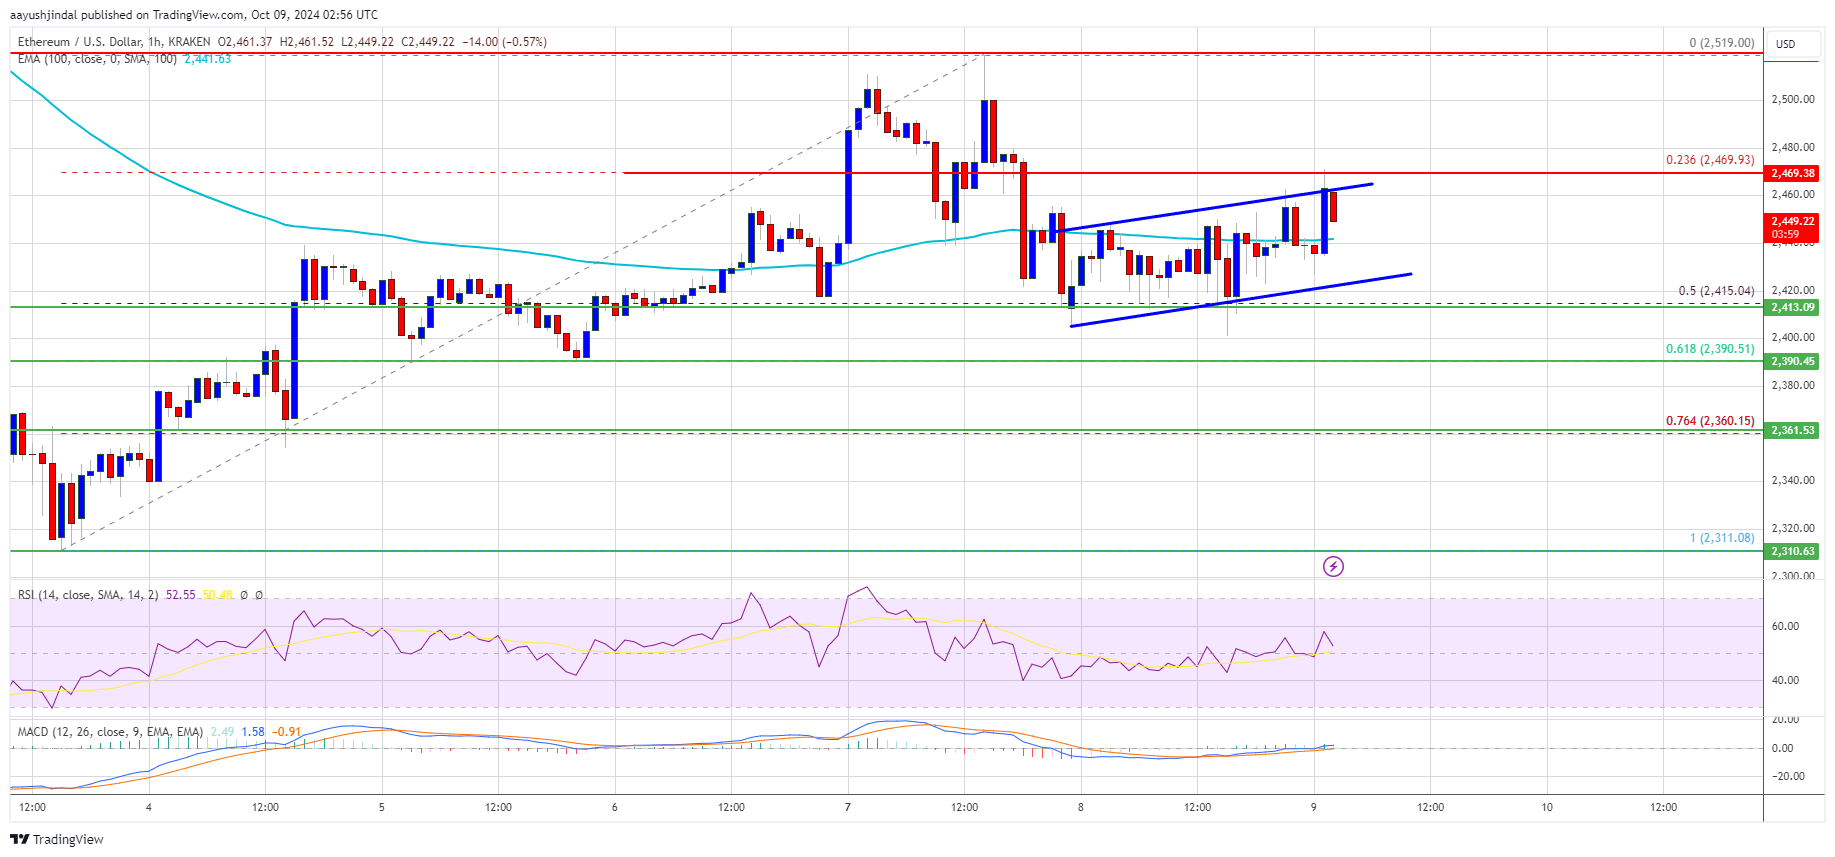
- On the hourly chart, ETH/USD is forming a short-term ascending channel with support at $2,420 (data feed via Kraken).
- The pair needs to remain above the $2,400 support level to start fresh gains in the near future.
Ethereum price holds support
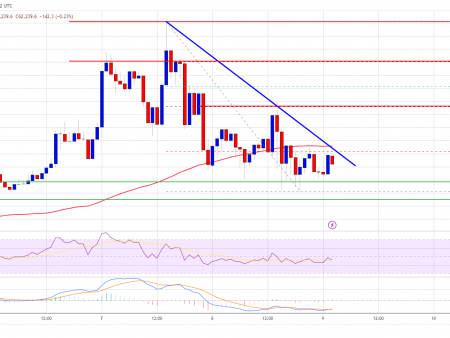
Ethereum price failed to rise above the $2,500 resistance zone. ETH, like Bitcoin, began a downward correction and traded below the $2,465 support zone.
There was also a movement below the $2420 level. The price tested the 50% Fibonacci retracement level of the ascending wave from the $2,310 swing low to $2,519 high. It looks like bulls are now defending more downside opportunities below the $2,400 support level.
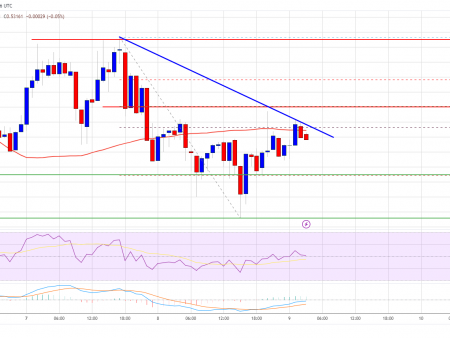
Ethereum price is currently trading just above $2,430 and the 100-hour simple moving average. On the downside, the price seems to be facing headwinds near the $2,465 level. A short-term ascending channel is also forming with support at $2,420 on the hourly ETH/USD chart.
A clear move above the $2,465 resistance could steer the price towards the $2,500 resistance. A break above the $2,500 resistance could call for further gains in the coming sessions. In the said case, Ether may rise to the $2,600 resistance zone in the near future. The next hurdle is at $2650 or $2665.
More losses in ETH?
If Ethereum fails to break through the $2,465 resistance, it could start another decline. Initial downside support lies near the $2,420 level. The first major support is near the $2,390 zone or the 61.8% Fibonacci retracement level of the uptrend from the $2,310 swing low to $2,519 swing high.
A clear move below the $2,390 support could push the price towards $2,325. Any further losses could push the price towards the $2,240 support level in the near future. The next key support is at $2120.
Technical indicators
Hourly MACD – The MACD for ETH/USD is losing momentum in the bearish zone.
Hourly RSI – The RSI for ETH/USD is now above the 50 zone.
The main support level is $2,390.
The main resistance level is $2,465.