- Ethereum exchange reserve has increased by 163 thousand ETH in the last five days.
- The number of new Ethereum holders has increased by more than 4 million in the last three months.
- Ethereum could bounce near $2400 support after moving average resistance.
Ethereum (ETH) fell more than 2% on Tuesday after indicating selling pressure due to a rise in its exchange reserves. However, other on-chain indicators point to mixed investor sentiment amid consolidation in ETH’s price.
Daily Market Drivers Digest: ETH Exchange Reserve Growth, New Holders Rise
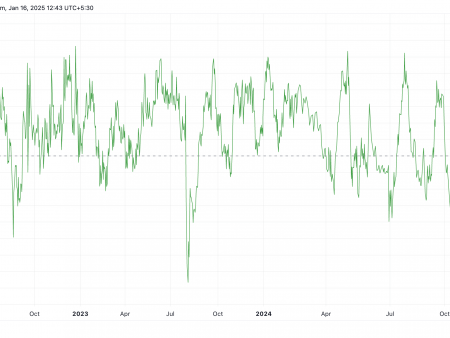
Since August 29, Ethereum’s exchange reserve has switched from a downward trend to an upward trend. Exchange reserve is the total amount of cryptocurrency held on an exchange. An increase in an asset’s exchange reserve indicates higher selling pressure, while a decrease indicates the opposite.
According to CryptoQuant, Ethereum’s exchange reserves have increased by about 163,000 ETH over the past five days, which is worth about $407.5 million. As a result, ETH could likely face short-term selling pressure until its exchange reserves begin to decline again.
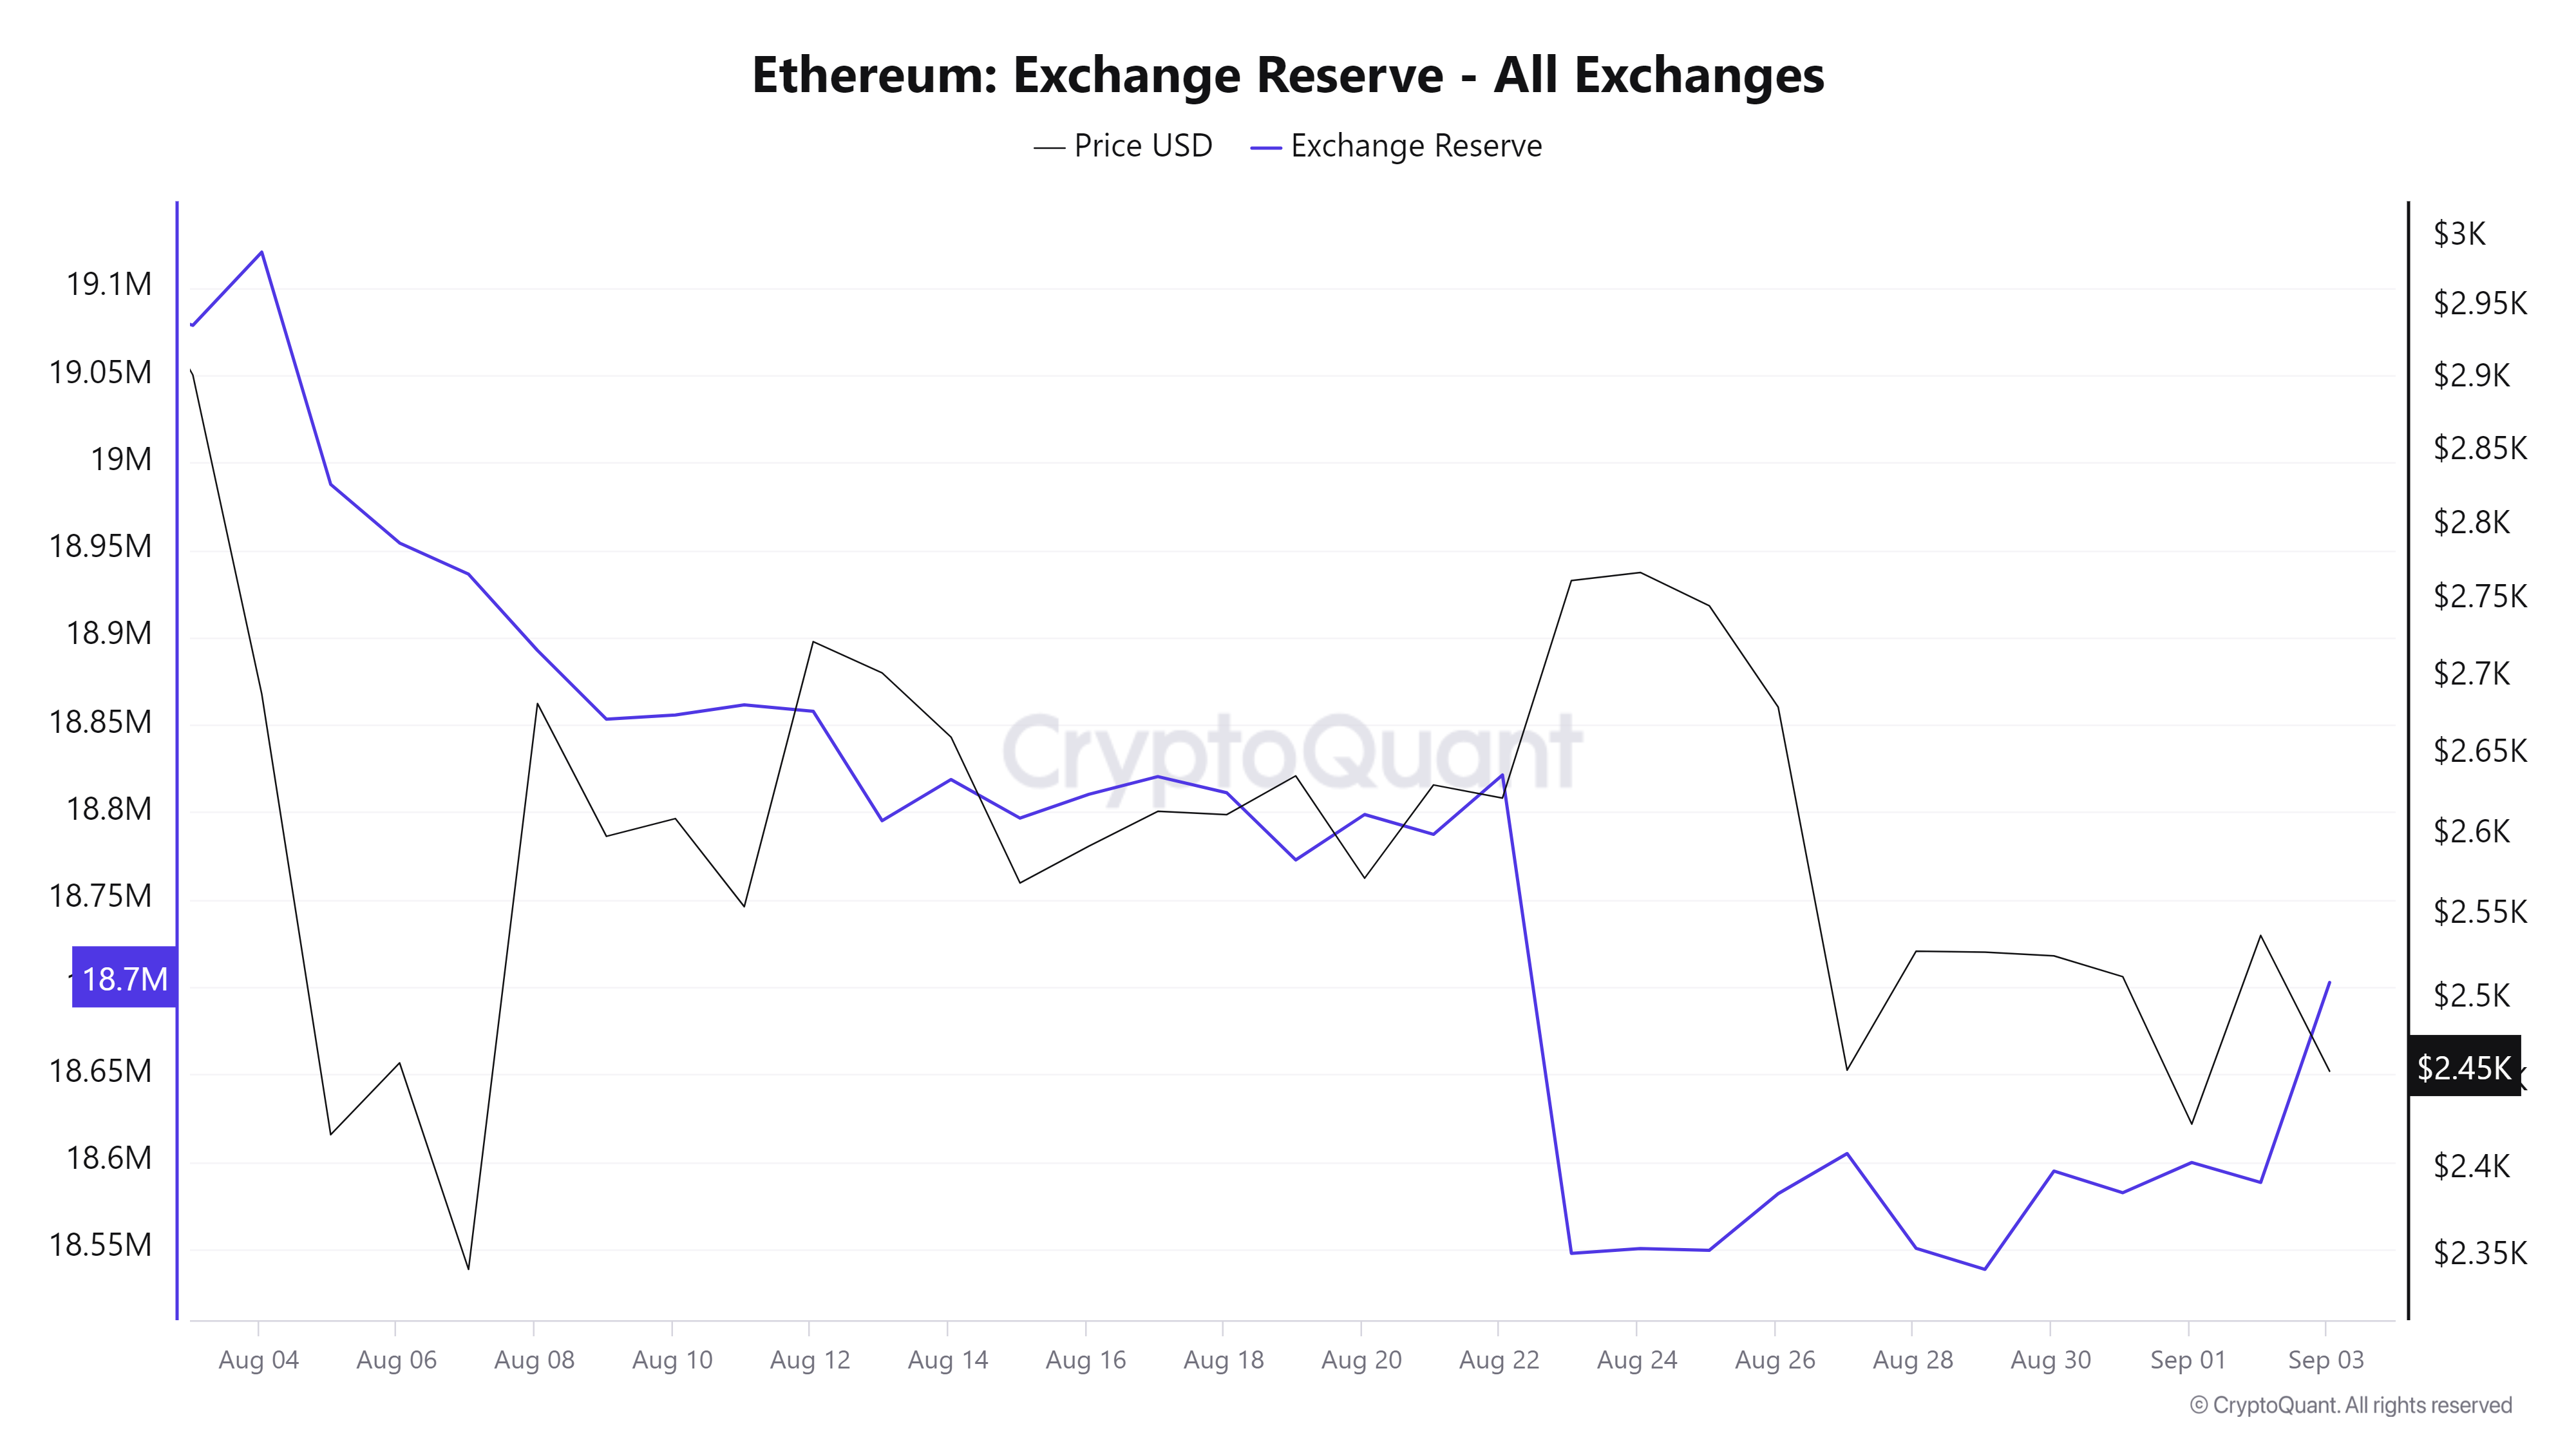
ETH exchange reserve
Meanwhile, despite Ethereum’s price lag, its total number of holders is on an upward trend, adding more than 4 million new non-empty wallets in the last three months, according to Santiment data. That brings the total number of ETH holders to nearly 127 million, meaning new market participants could be betting on ETH’s price to rise in the long term. By comparison, the total number of BTC holders has fallen by 50,000 over the same period.
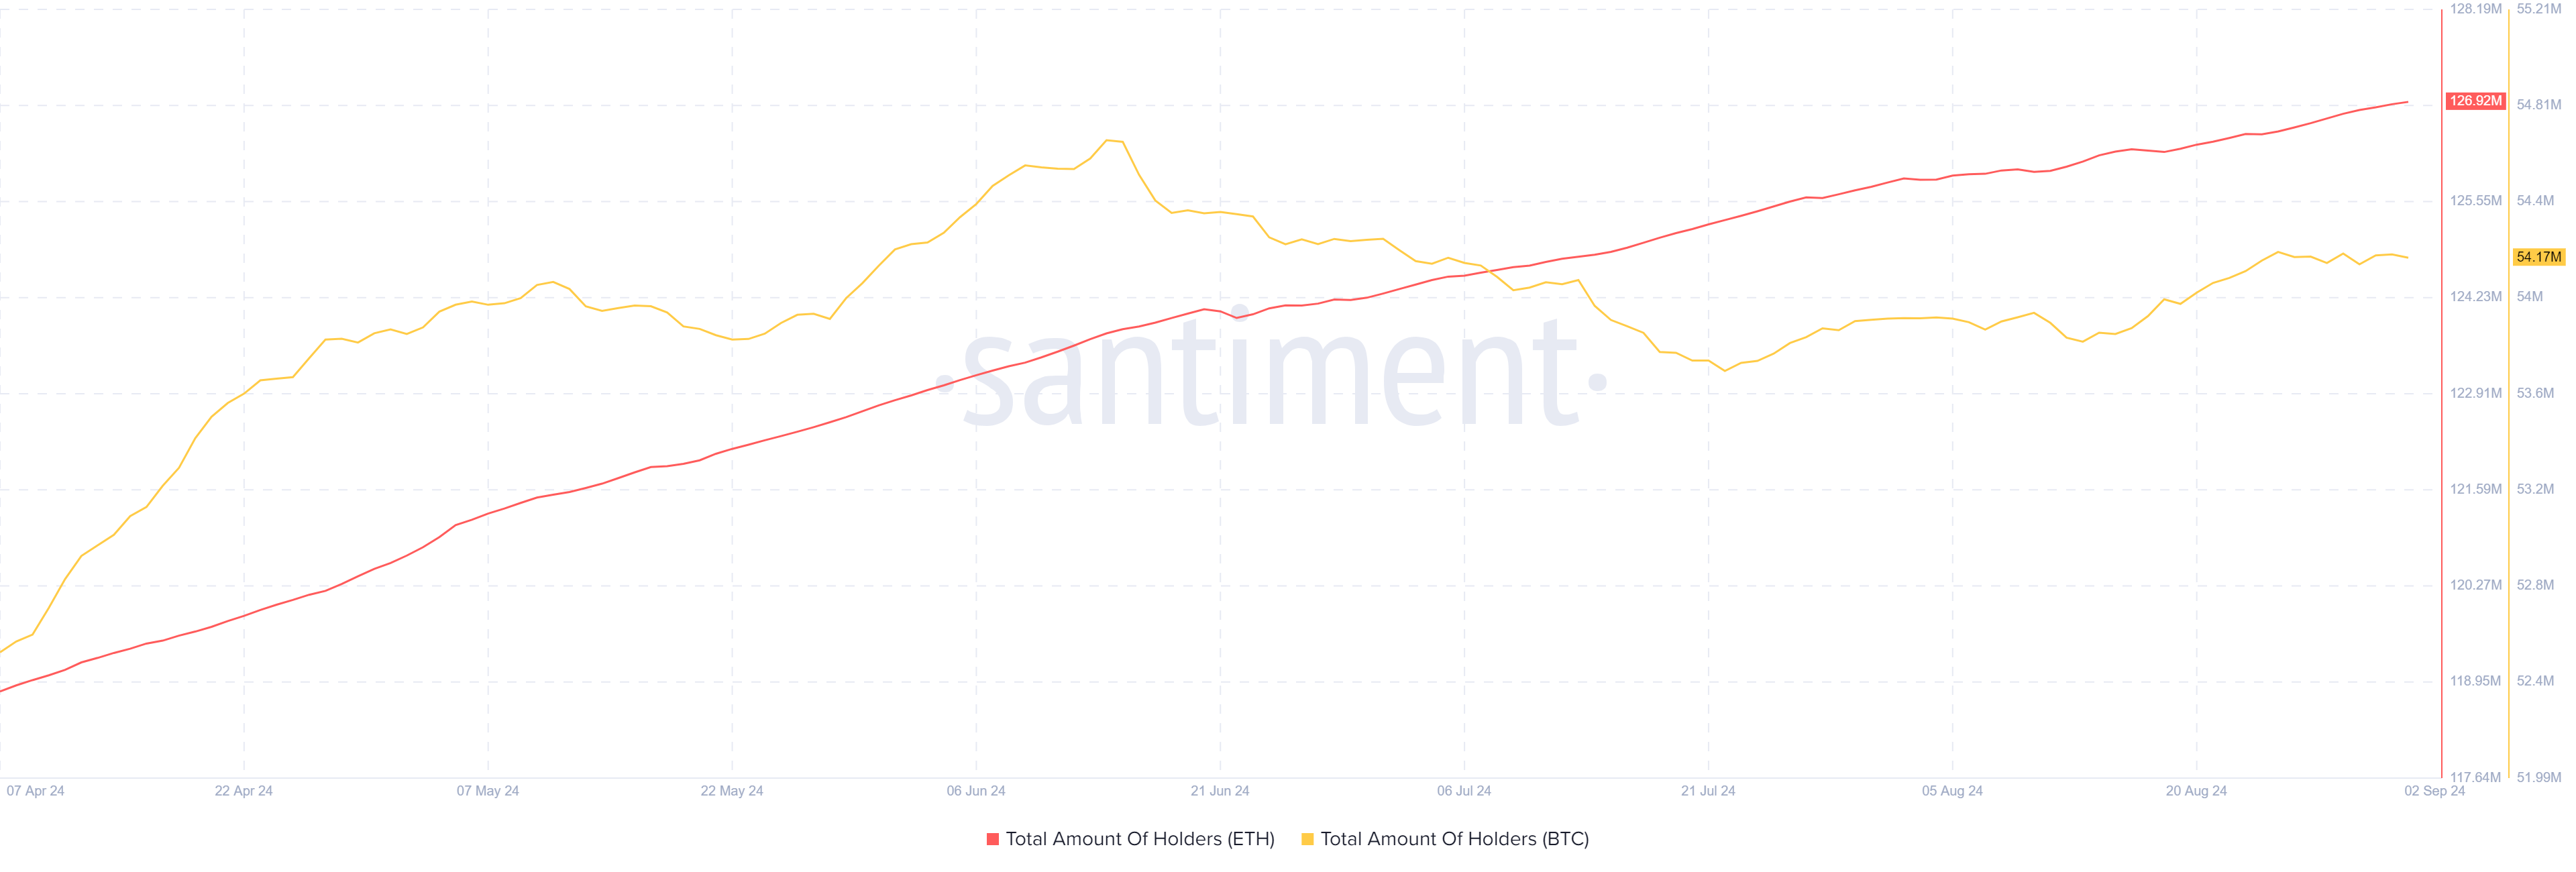
ETH vs BTC Total Holders
While the number of Ethereum holders is growing, whale activity on the network has dropped significantly from its peak during the market rally in early March. According to data from Santiment, the number of Ethereum whale transactions has dropped from more than 115,000 whale transactions between March 13 and March 19 to 31,800 between August 21 and August 27 — only about a quarter of the number of whale transactions in March.
The decline is evidenced by the decrease in ETH volatility over the past few months, with the exception of a single market spike on May 20 and a crash on August 5. Whale activity often peaks when volatility increases, analysts at Santiment note.
ETH Technical Analysis: Ethereum May Bounce Off Key Support Level
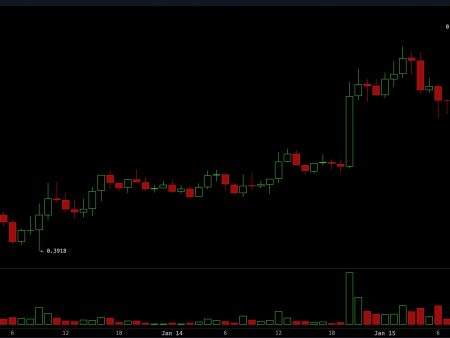
Ethereum is trading around $2,450 on Tuesday, down 2.5% on the day. ETH has seen $26.94 million worth of liquidations in the last 24 hours, with long and short liquidations totaling $22.13 million and $4.81 million, respectively.
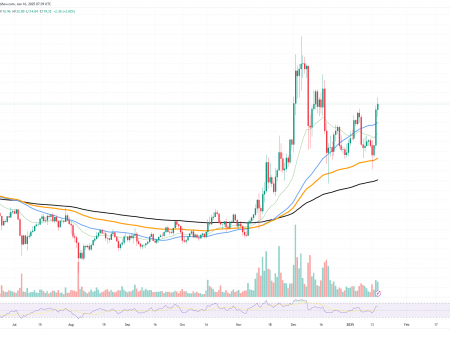
On the 4-hour chart, ETH’s upward move has been capped by the convergence of the 200-day, 100-day, and 50-day simple moving averages (SMA) in the European trading session. As a result, ETH is attempting to move lower in a key rectangle with support and resistance levels at $2,400 and $2,817, respectively.
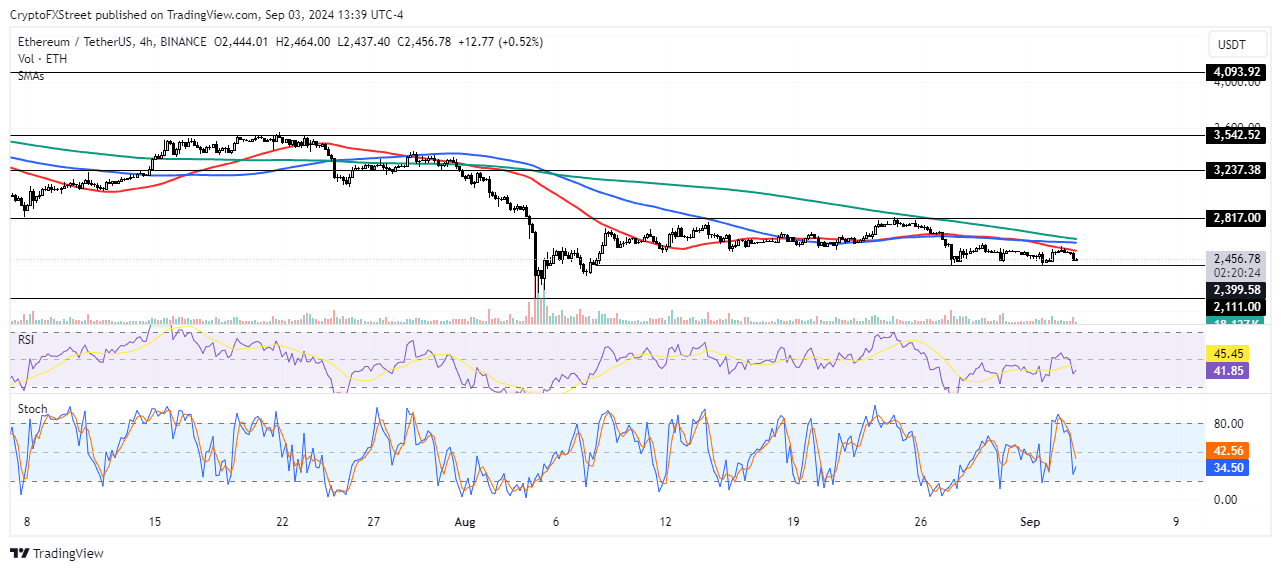
ETH/USDT 4-hour chart
According to Coinglass, ETH could bounce off the $2,400 support level and rally again, but only after potentially liquidating $40.8 million worth of positions at $2,424.
A breakout of the key rectangle will likely determine the next price trend for ETH. A break of the $2,400 support level could send ETH to $2,111. A successful break above the $2,817 level and SMA resistance would see ETH rally to $3,237.
The Relative Strength Index (RSI) and the Stochastic Oscillator (Stoch) %K line are falling below their centerlines, indicating a near-term bearish outlook.
