- The decline in open interest in Ethereum suggests that traders are becoming more cautious.
- Spot traders may be buying on the dip following growing net outflows from the ETH exchange.
- Weak demand for Ethereum ETFs has prompted asset managers to consider filing for combined ETH and BTC spot ETFs.
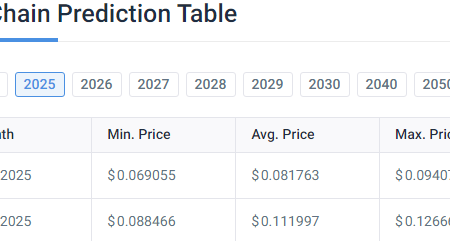
- Ethereum could grow by 30% if the “double bottom” trend continues.
Ethereum (ETH) rose more than 2% on Wednesday as spot traders potentially pounce on the market’s recent decline to buy the dip. Meanwhile, the top altcoin formed a double bottom on the daily chart, indicating potential for a 30% rally.
Daily Market Drivers Digest: ETH OI, Exchange Outflows, Weak Ethereum ETFs
After ETH fell 9% on Tuesday, Ethereum’s open interest briefly fell by nearly $1 billion to $10.42 billion before recovering slightly. Open interest (OI) is the total number of outstanding derivatives positions in an asset’s market. A decline in OI indicates that traders are either liquidating or closing their positions. In Ethereum’s case, a decline in OI suggests that traders are becoming more cautious.
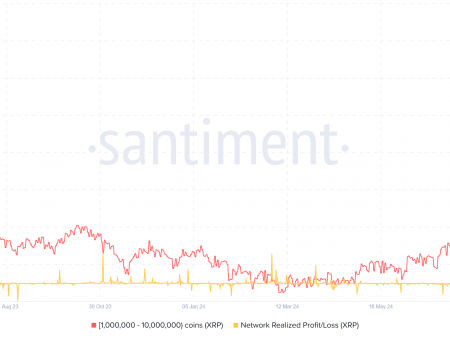
On the other hand, spot traders seem to be buying the dip, given that ETH net exchange flow turned into net outflow of 65.2k ETH in the first hours of the US session, according to CryptoQuant data. Net exchange flow is the difference between coins entering and leaving exchanges. Outflows suggest that buying pressure is prevailing, while the opposite is true for inflows. If buying pressure persists, ETH could see a correction to previous highs.
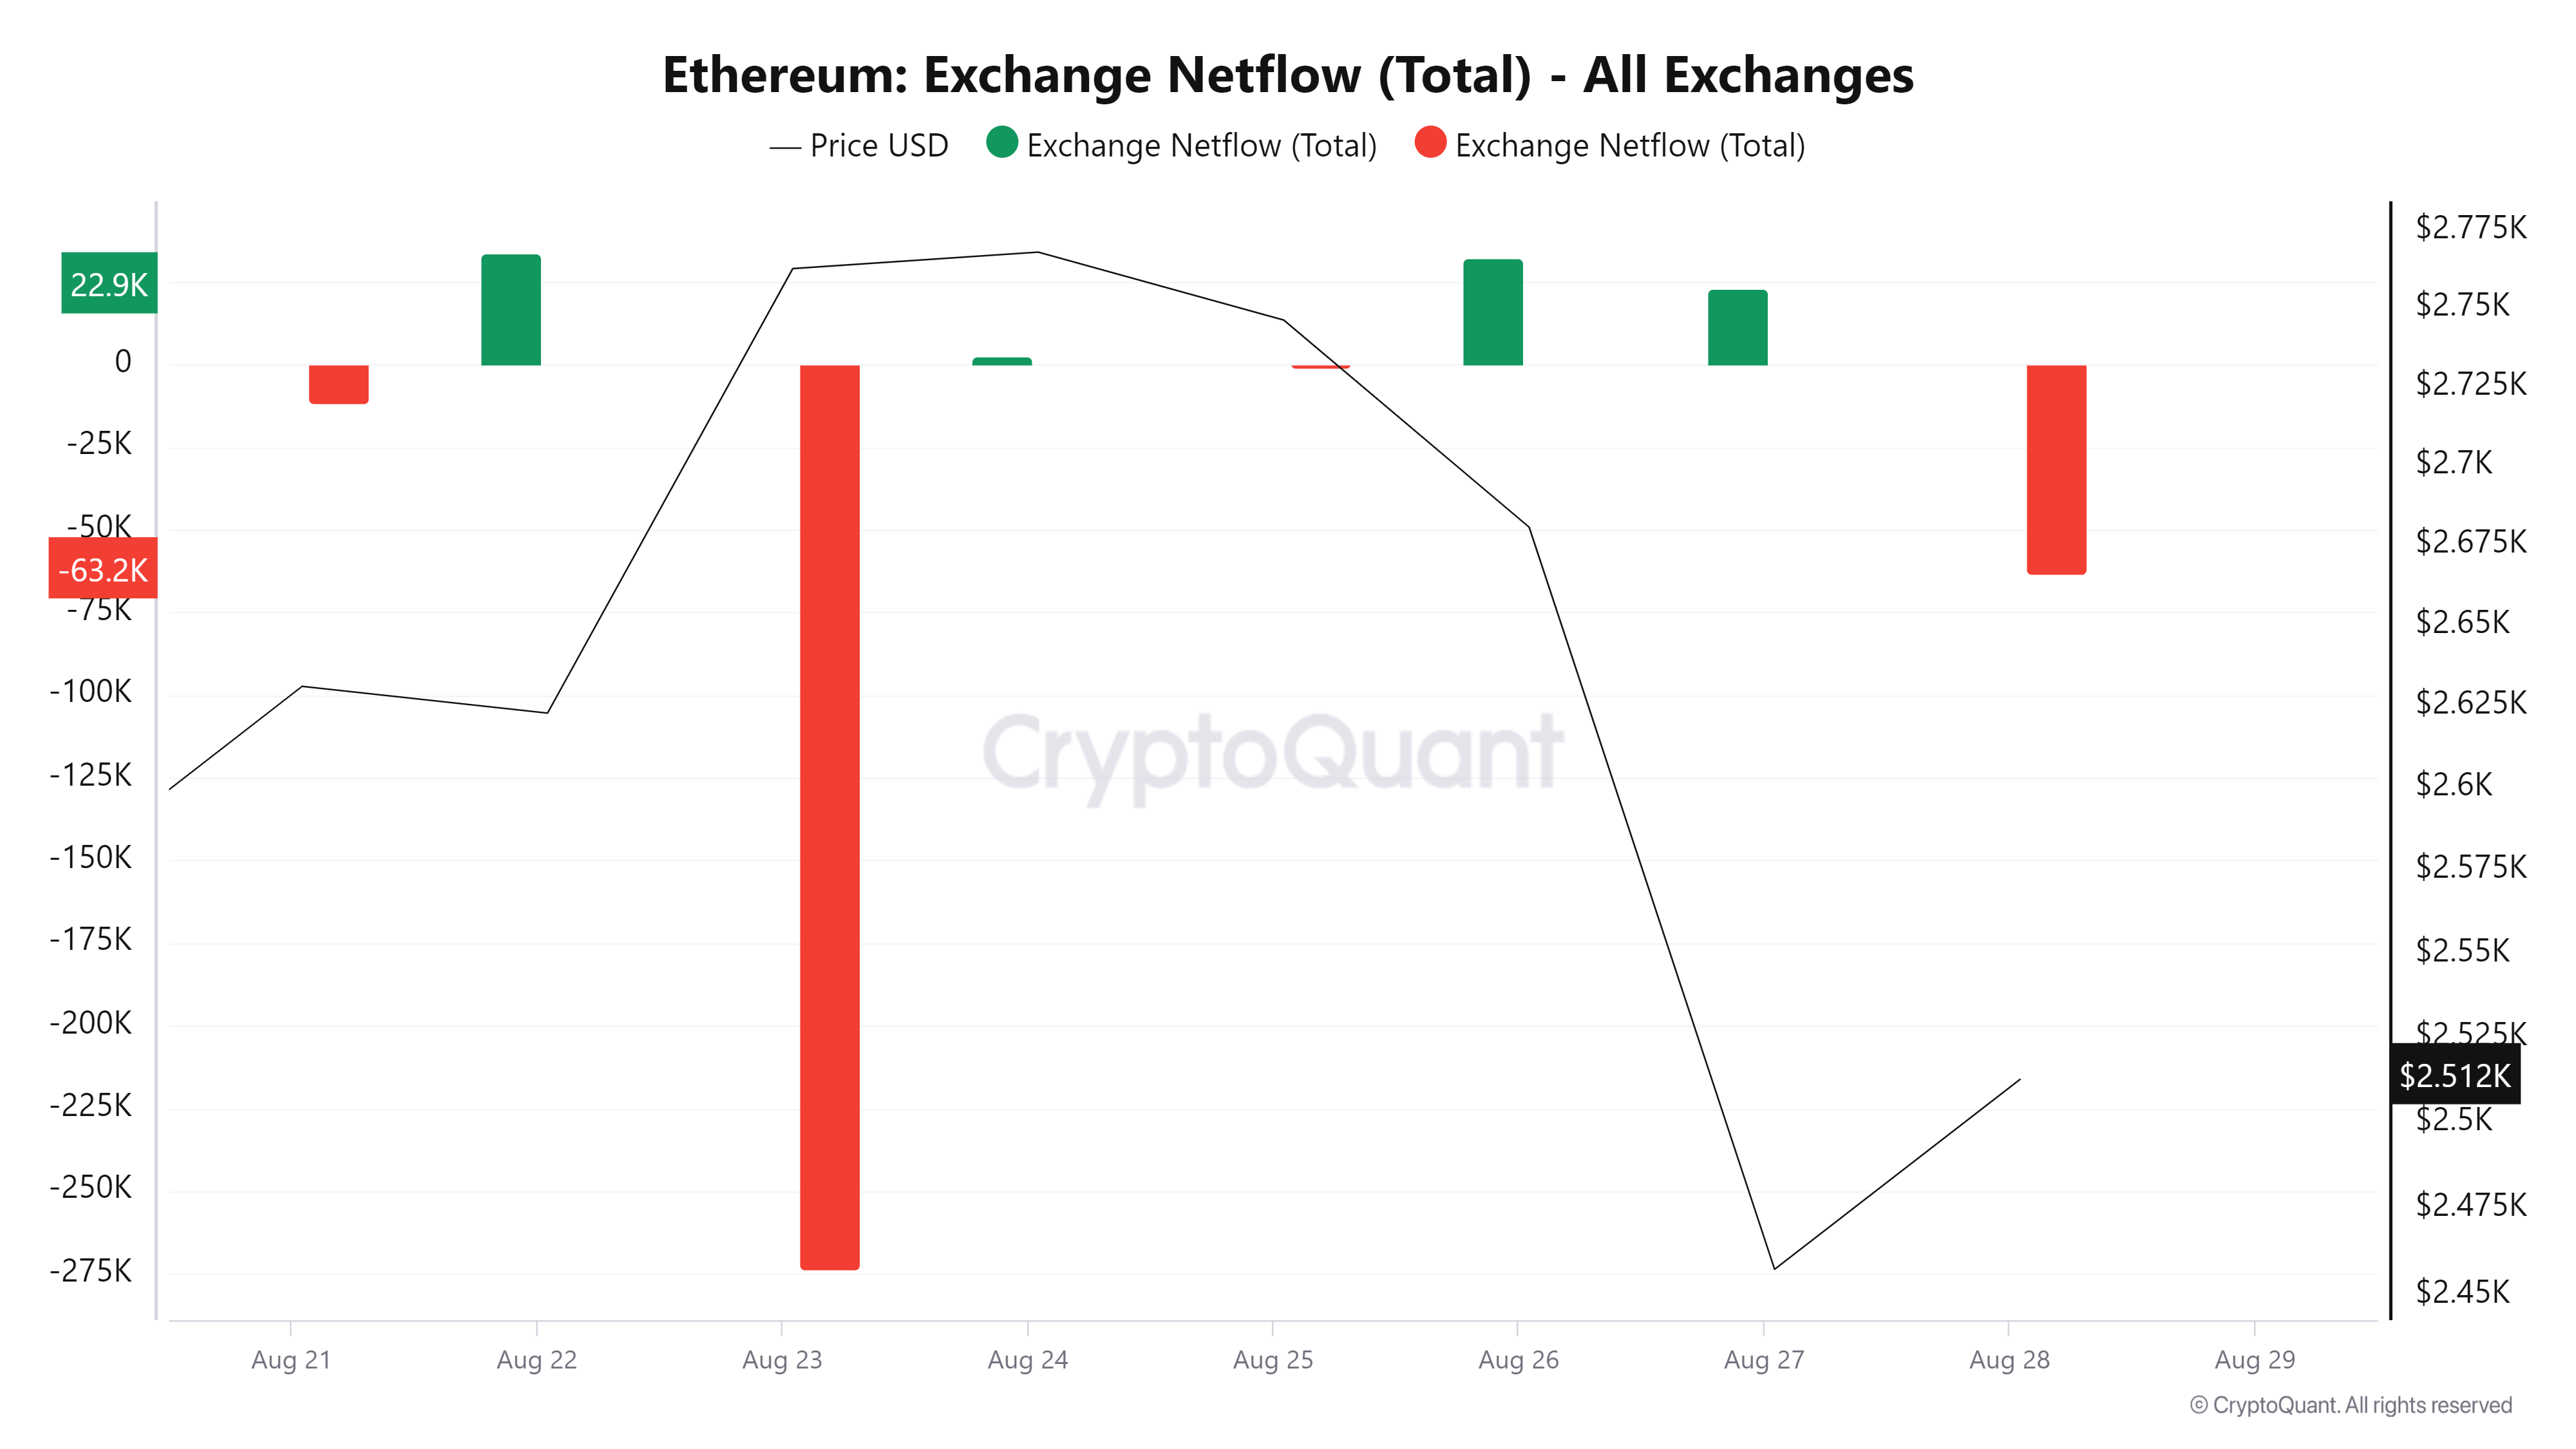
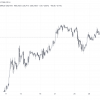
ETH Exchange Netflow
On the ETF front, Ethereum ETFs extended their streak to nine consecutive days of negative flows after posting $3.4 million in net outflows on Tuesday. Despite ETH’s price decline, Fidelity’s FETH and Bitwise’s ETHW managed to post net inflows of $3.9 million and $1.9 million, respectively. However, a $9.2 million outflow from Grayscale’s ETHE flipped the overall net flow figure to negative. Unlike crypto exchanges, outflows to ETFs suggest dominant selling pressure, while the opposite is true for inflows.
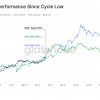
Increasing outflows have resulted in ETH ETF net flows approaching $500 million in the first five weeks after launch. By comparison, Bitcoin ETFs have seen over $5 billion in net inflows in their first five weeks.
According to analysts at JP Morgan, weak ETH ETF flows compared to Bitcoin ETFs were expected due to the lack of staking and lower liquidity. The analysts noted that Grayscale ETHE outflows exceeded their expectations of ~$1 billion. Weak demand for ETH ETFs has prompted asset managers to consider a combined spot BTC and ETH ETF.
“With weaker demand for spot Ethereum ETFs compared to Bitcoin, there is growing interest among asset managers to apply for a combined ETF offering exposure to Bitcoin and Ethereum,” JP Morgan analysts noted.
ETH Technical Analysis: Ethereum May Grow by 30%
Ethereum is trading around $2,520 on Wednesday, up more than 2% on the day. ETH has seen $85.45 million in liquidations over the past 24 hours, with long and short liquidations totaling $67.29 million and $18.16 million, respectively.
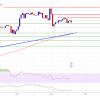
Ethereum is forming a W-shaped pattern or double bottom on the daily chart after posting two key price lows on August 8 and 27. When this occurs during a downtrend, the double bottom is considered a potential bullish reversal. However, ETH needs to move above the neckline resistance at $2,817 to confirm the pattern.
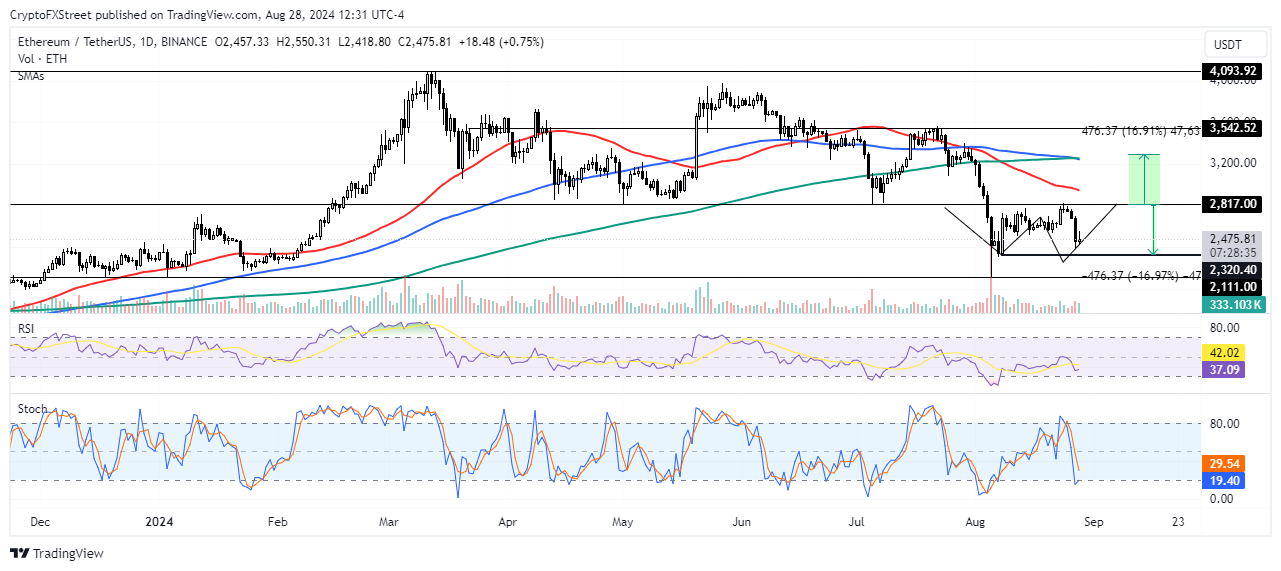
ETH/USDT Daily Chart
A successful completion of this move could see ETH rise by more than 30% to the psychological level of $3,300. However, the 100-day and 200-day simple moving averages (SMA) could become resistance on the way up. Failure to overcome the resistance of $2,817 could send ETH to the support level near $2,320.
The Relative Strength Index (RSI) is showing a bearish trend as it is trending lower after breaking below its moving average on Monday.
The %K line of the Stochastic Oscillator (Stoch) moved into oversold territory on Tuesday and is at 17 at the time of writing. If the %K line manages to cross above its descending %D line in oversold territory, it could signal a bullish reversal.