When memecoins go parabolic, it is usually a sign of the market’s top and a warning that investor euphoria has peaked. The market witnessed similar speculative fury in the 2020 to 2021 bull market, as Dogecoin (DOGE) chased the dollar, Shiba Inu (SHIB) rallied tens of thousands of percent, and NFT prices hit dazzling highs of six to seven digits.
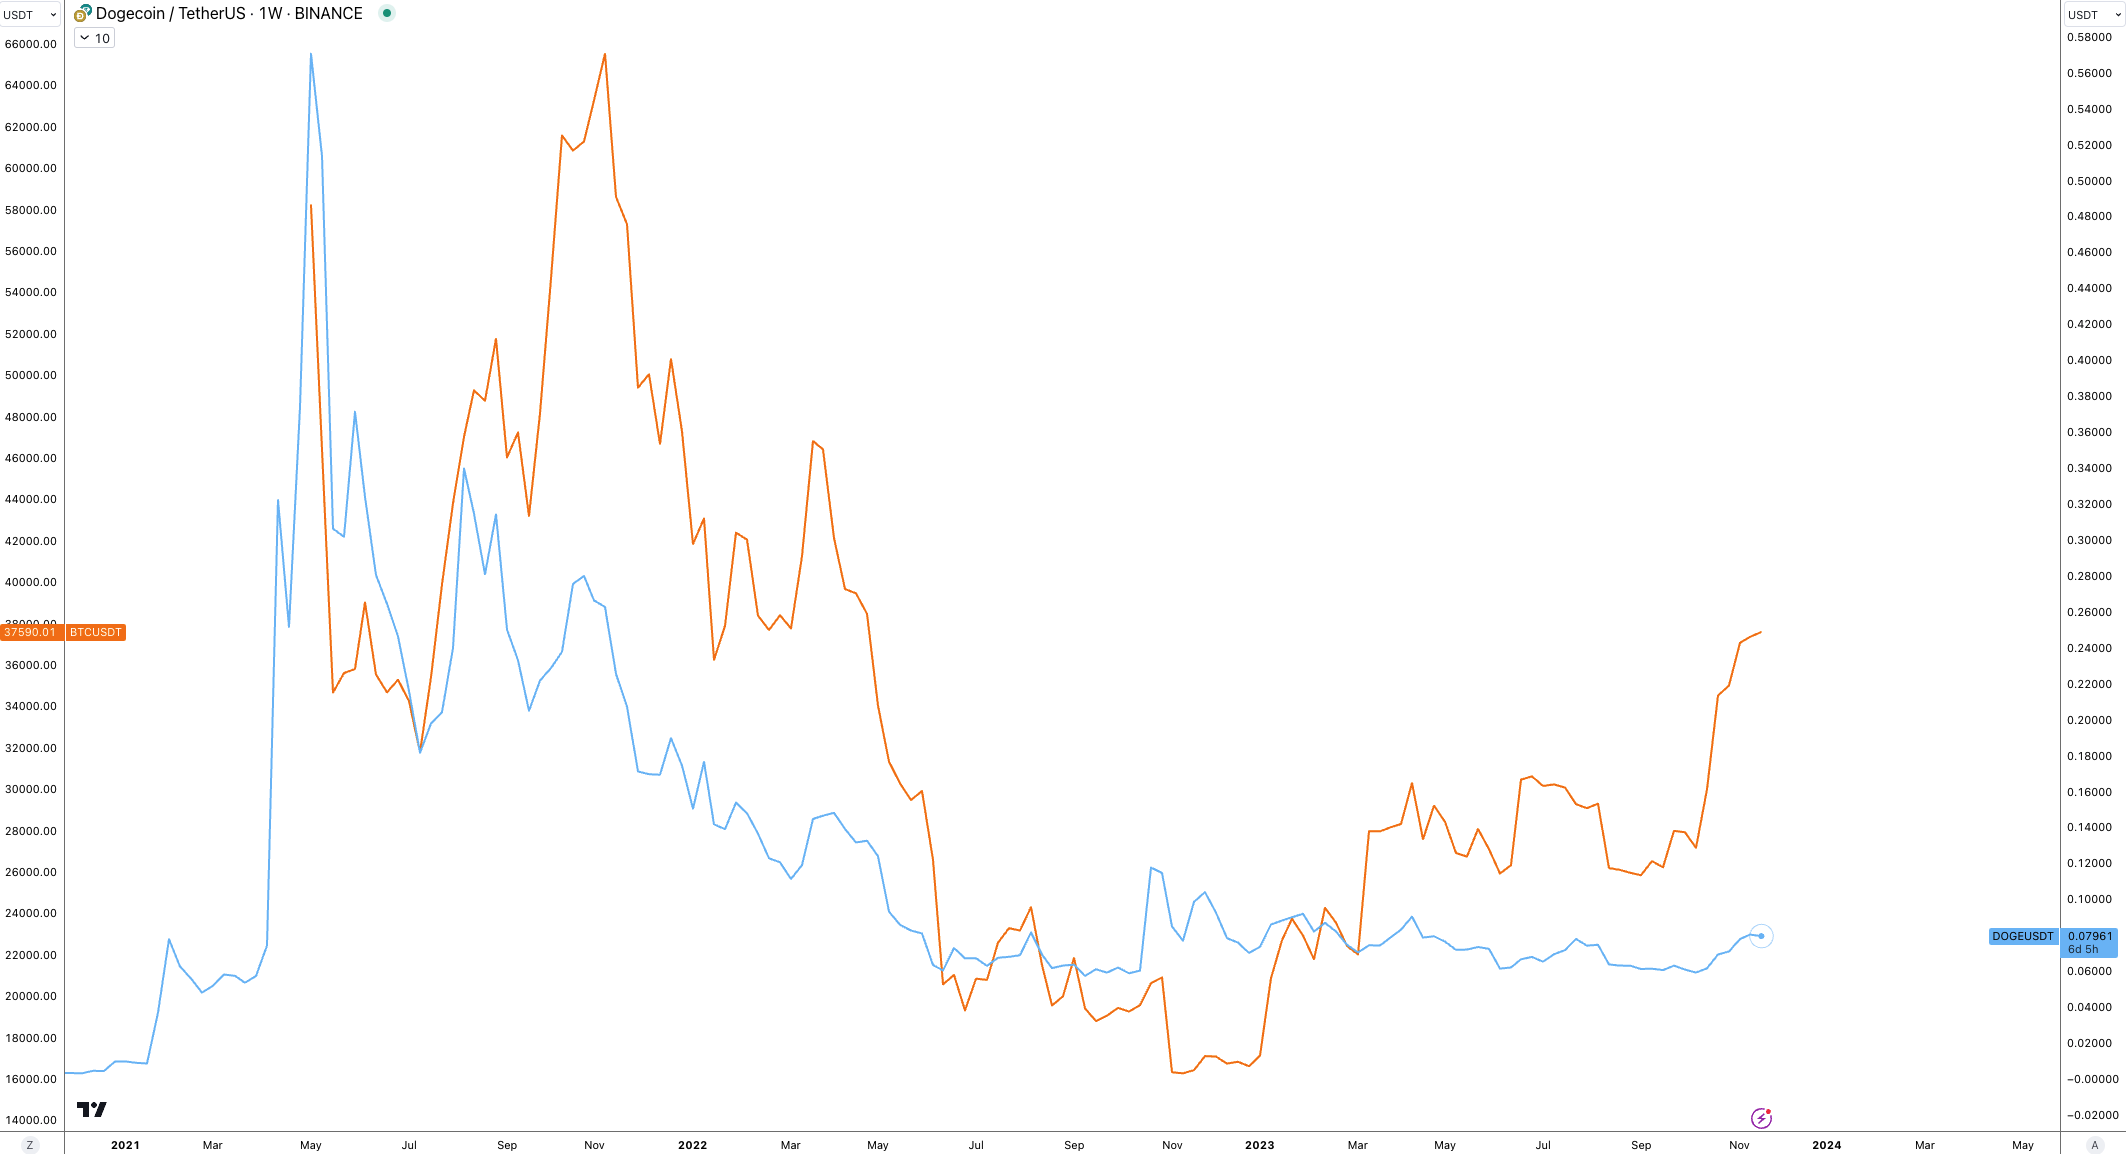
Despite being up just 13.6% for the year, DOGE’s 33.2% gain over the past month has put the asset on the radar of some analysts.
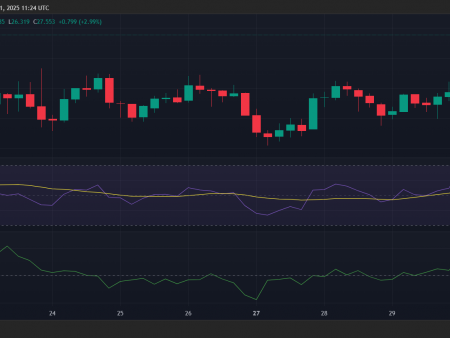
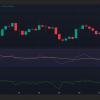
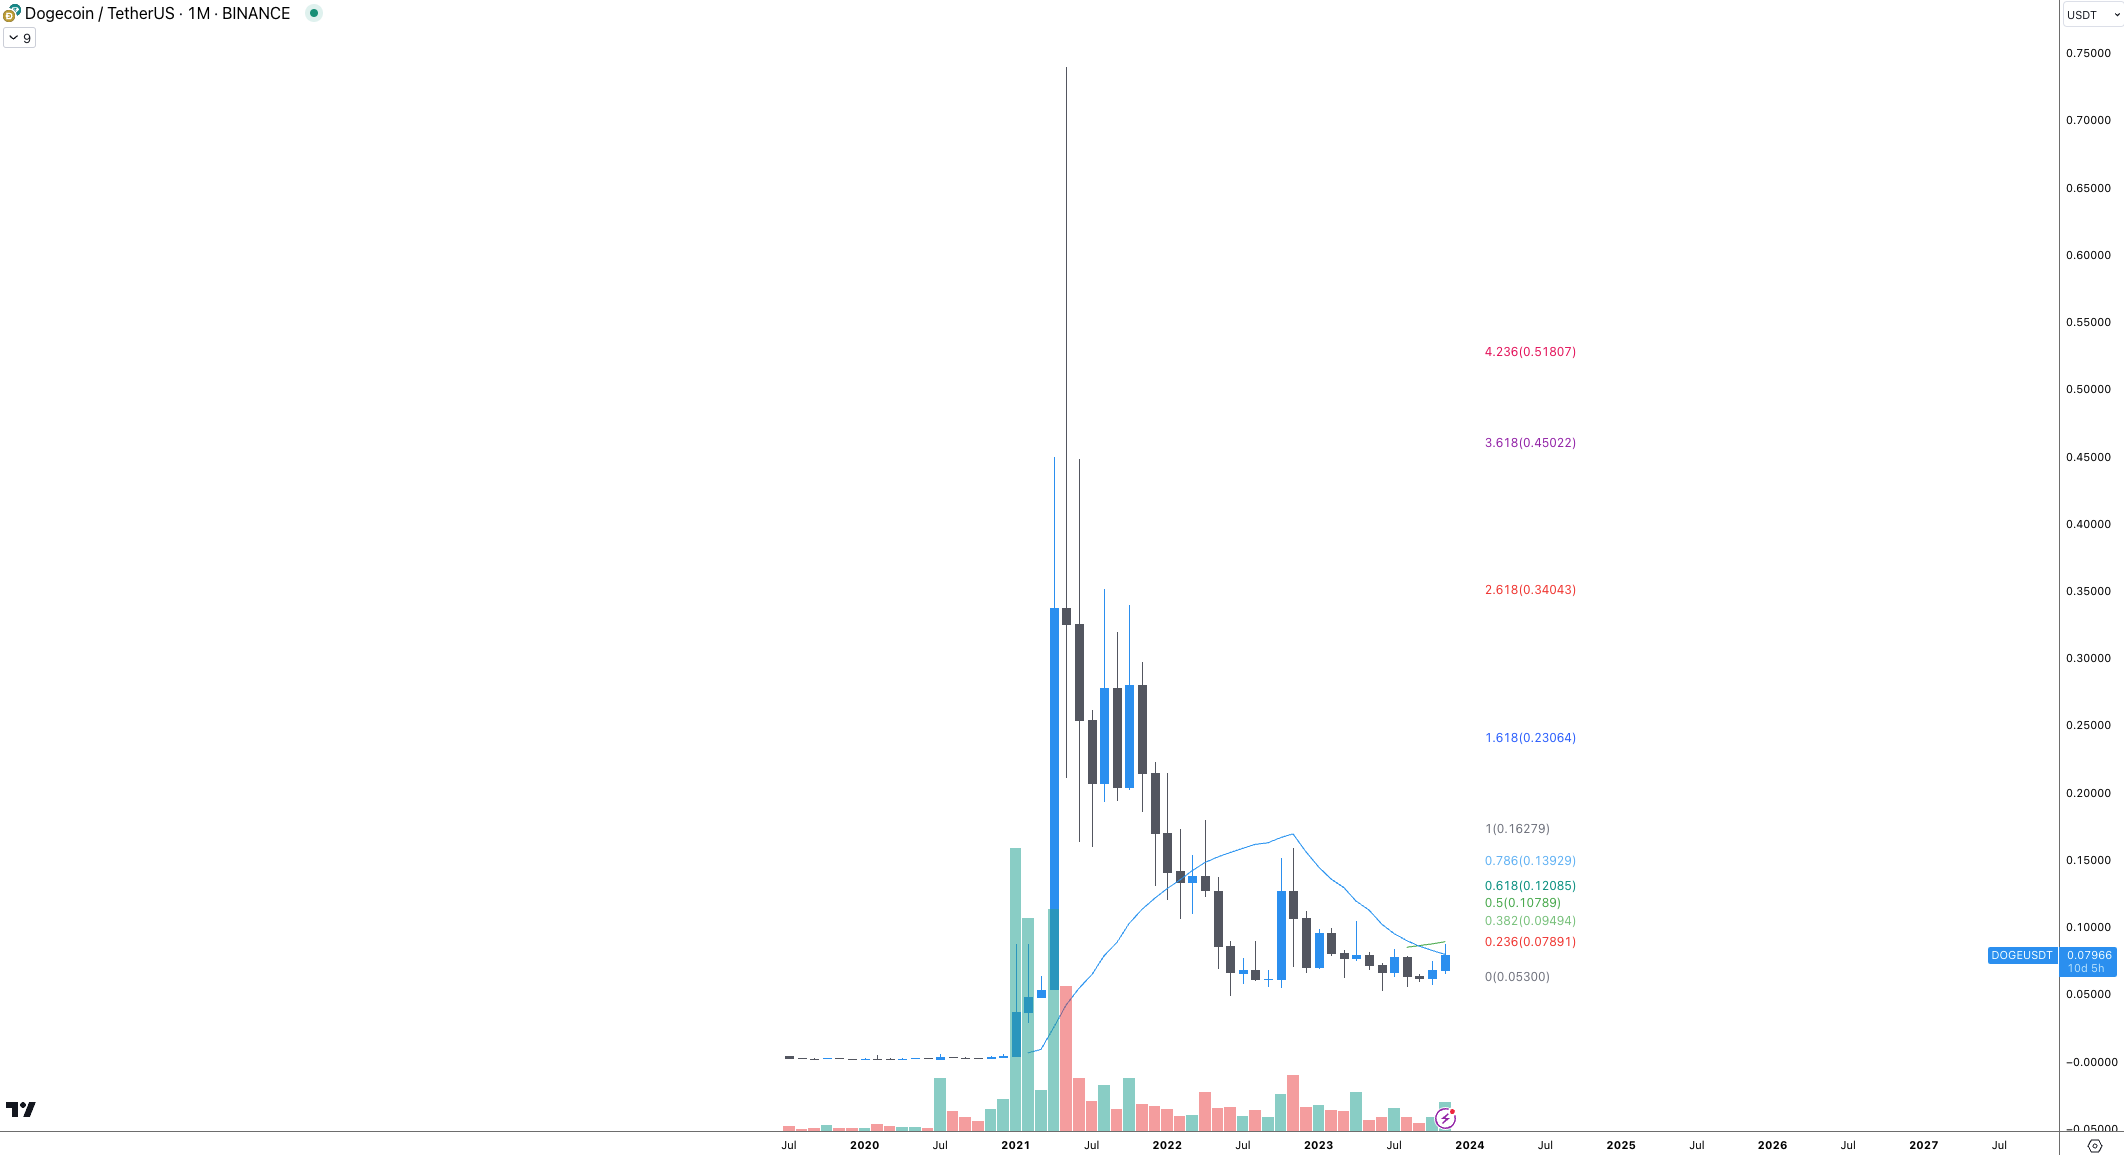
Take, for example, cryptocurrency trader Tony “The Bull,” who noted that DOGE price rose to the one-month parabolic SAR indicator, a move that the trader said was previously followed by a 23,000% rally.
For traders using technical analysis, the Parabolic SAR is typically used to identify “stop and reverse” signals of an asset. In short, it is used to determine the price levels at which an asset could stop in its current direction and begin a trend change.
This dog is ready to bite. #Dogecoin 1M parabolic SAR labels
The last signal produced a $DOGE 23,000% recovery pic.twitter.com/ZGr9eFCaea
— Tony “El Toro” (@tonythebullBTC) November 16, 2023
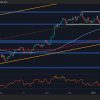
Traders have also pointed to DOGE’s Fibonacci levels as a guide to where the price could be heading in the medium term. Citing the monthly time frame, $0.12 at the 0.618 Fib level has been identified as a medium-term target, while the 1.618 Fib level suggests $0.23 as the end of the current DOGE swing trade.
Related: Price Analysis 11/20: SPX, DXY, BTC, ETH, BNB, XRP, SOL, ADA, DOGE, LINK
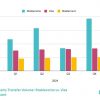
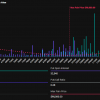
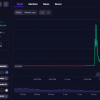
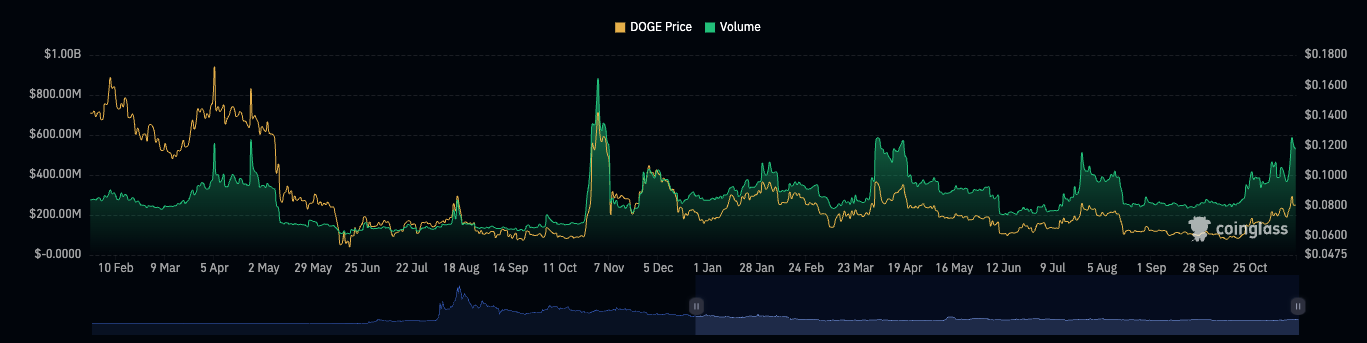
Trading volumes and open interest were another pair of notable metrics that traders focused on last week, as DOGE open interest soared to a 2-month high and trading volume hit a 6-month high .
This article does not contain investment advice or recommendations. Every investment and trading move involves risks, and readers should conduct their own research when making a decision.