Cardano price began a new decline below the $0.3550 zone. ADA is consolidating above $0.3400 and may attempt a recovery wave.
- The price of ADA began to move down below the support level of $0.3500.
- The price is trading below $0.3520 and the 100-hour simple moving average.
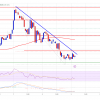
- On the hourly chart of the ADA/USD pair (data source Kraken), a key bearish trend line is forming with resistance at $0.3460.
- The pair may continue moving down if it remains below the $0.3520 resistance zone.
Cardano price consolidates losses
After testing the $0.3680 resistance, Cardano struggled to continue rising. ADA formed a short-term top and began a new decline, like Bitcoin and Ethereum. There was a movement below the support levels of $0.3550 and $0.3500.
The price even dropped below $0.3450 before the bulls emerged. The low was formed at $0.3409, and the price is now consolidating losses. There was a slight movement above the $0.3450 level. The price tested the 23.6% Fibonacci retracement level in a downward move from the swing high of $0.3681 to the low of $0.3409.
Cardano price is currently trading below $0.3520 and the 100-hour simple moving average. On the other hand, the price may face resistance near the $0.3460 zone. On the hourly chart of the ADA/USD pair, a key bearish trend line is also forming with resistance at $0.3460.
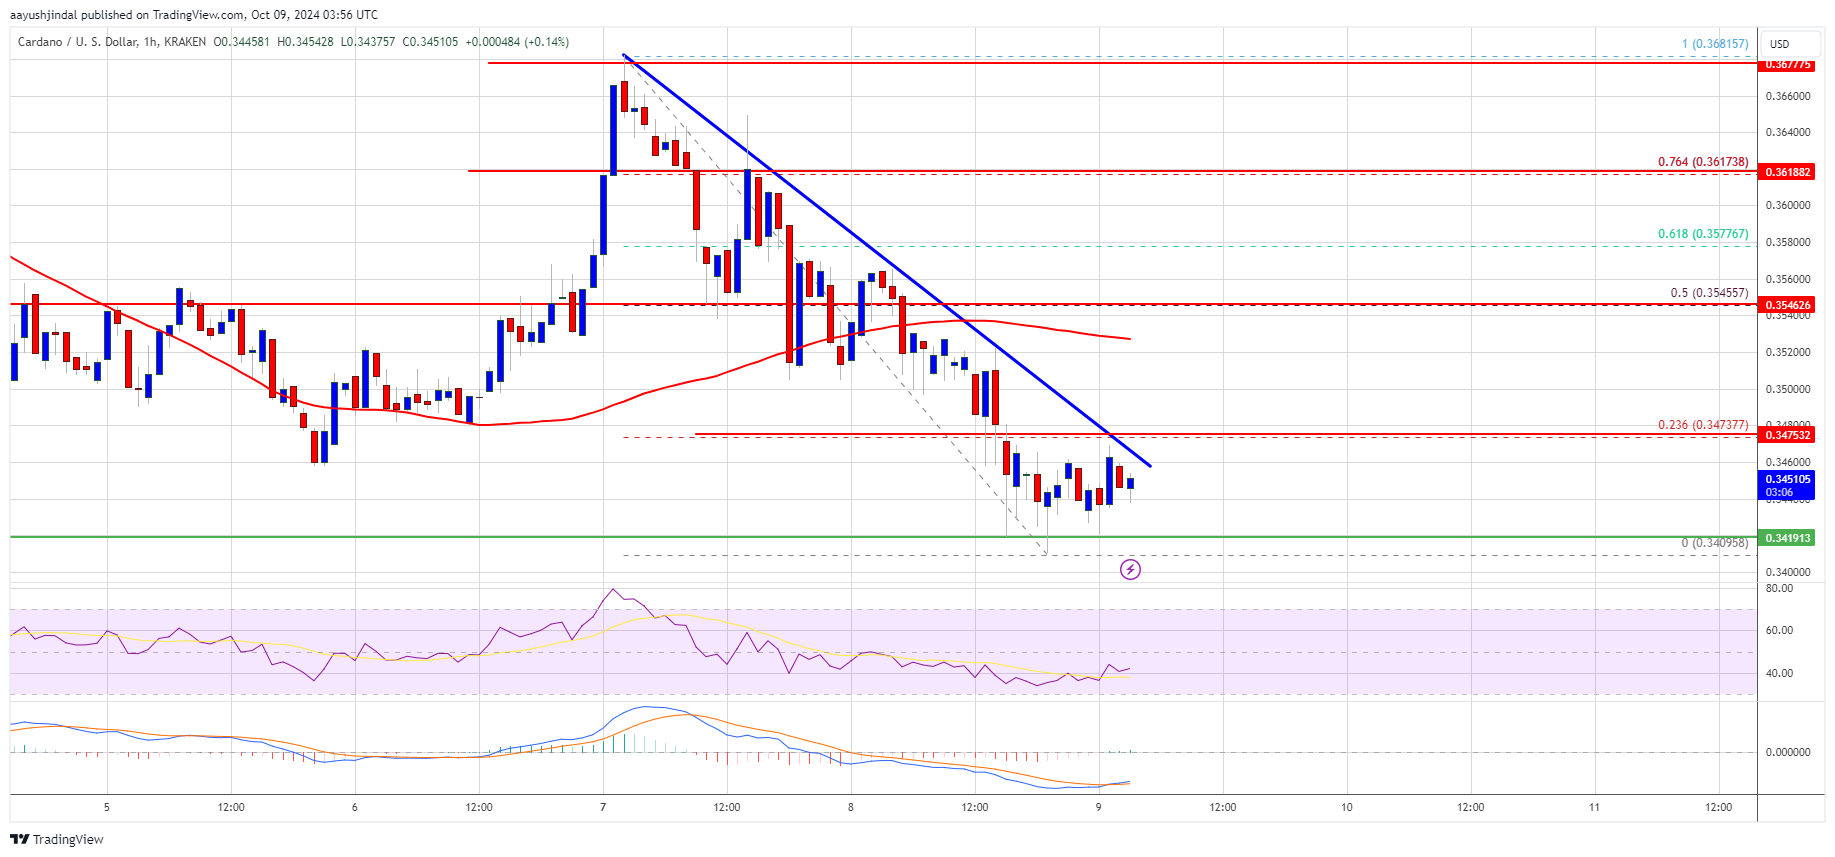
First resistance is near $0.3520 or the 50% Fibonacci retracement level of the downward move from the $0.3681 swing high to $0.3409 low. The next key resistance could be $0.3550. If there is a close above the $0.3550 resistance, the price could start to rise strongly. In this case, the price may rise to the area of $0.3680. Any additional gains may require a move towards $0.400.
More flaws in the ADA?
If Cardano’s price fails to rise above the $0.3550 resistance level, it may begin another decline. The nearest support during the fall is near the $0.3420 level.
The next major support is near the $0.3400 level. A break below $0.3400 could open the door to a test of $0.3250. The next major support is near the $0.3120 level, where bulls could emerge.
Technical indicators
Hourly MACD – The MACD for ADA/USD is losing momentum in the bearish zone.
Hourly RSI (Relative Strength Index) – The RSI for ADA/USD is currently below the 50 level.
The main support levels are $0.3400 and $0.3350.
The main resistance levels are $0.3460 and $0.3550.