Bitcoin price has not yet reached the $100K mark, but given the current state of the market, it seems only a matter of time.
Bitcoin Price Analysis
Edris Derakhshi (TradingRage)
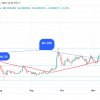
Daily chart
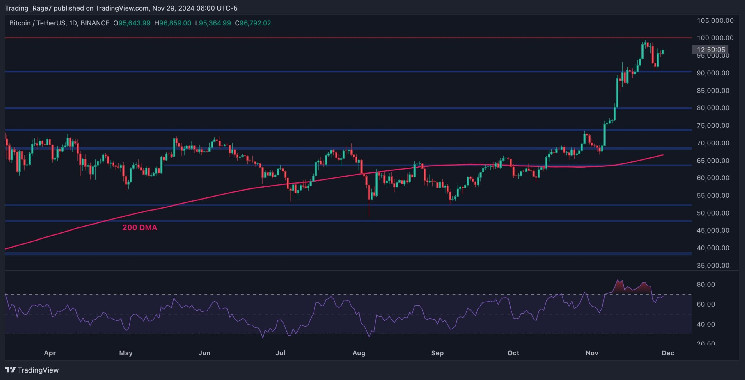
The daily chart shows a clear picture of Bitcoin’s price action over the past 9 months, with the market consolidating until early November of this year.
However, after the price stabilized above the 200-day moving average, which is currently hovering around the $68K mark, the market began to rise aggressively and create new all-time highs daily.
Meanwhile, a few days ago the price experienced a pullback, shortly before reaching the $100 thousand mark. However, the $90k support level has pushed the price back up and Bitcoin could finally reach the $100k level in the next few days.
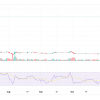
4 hour chart
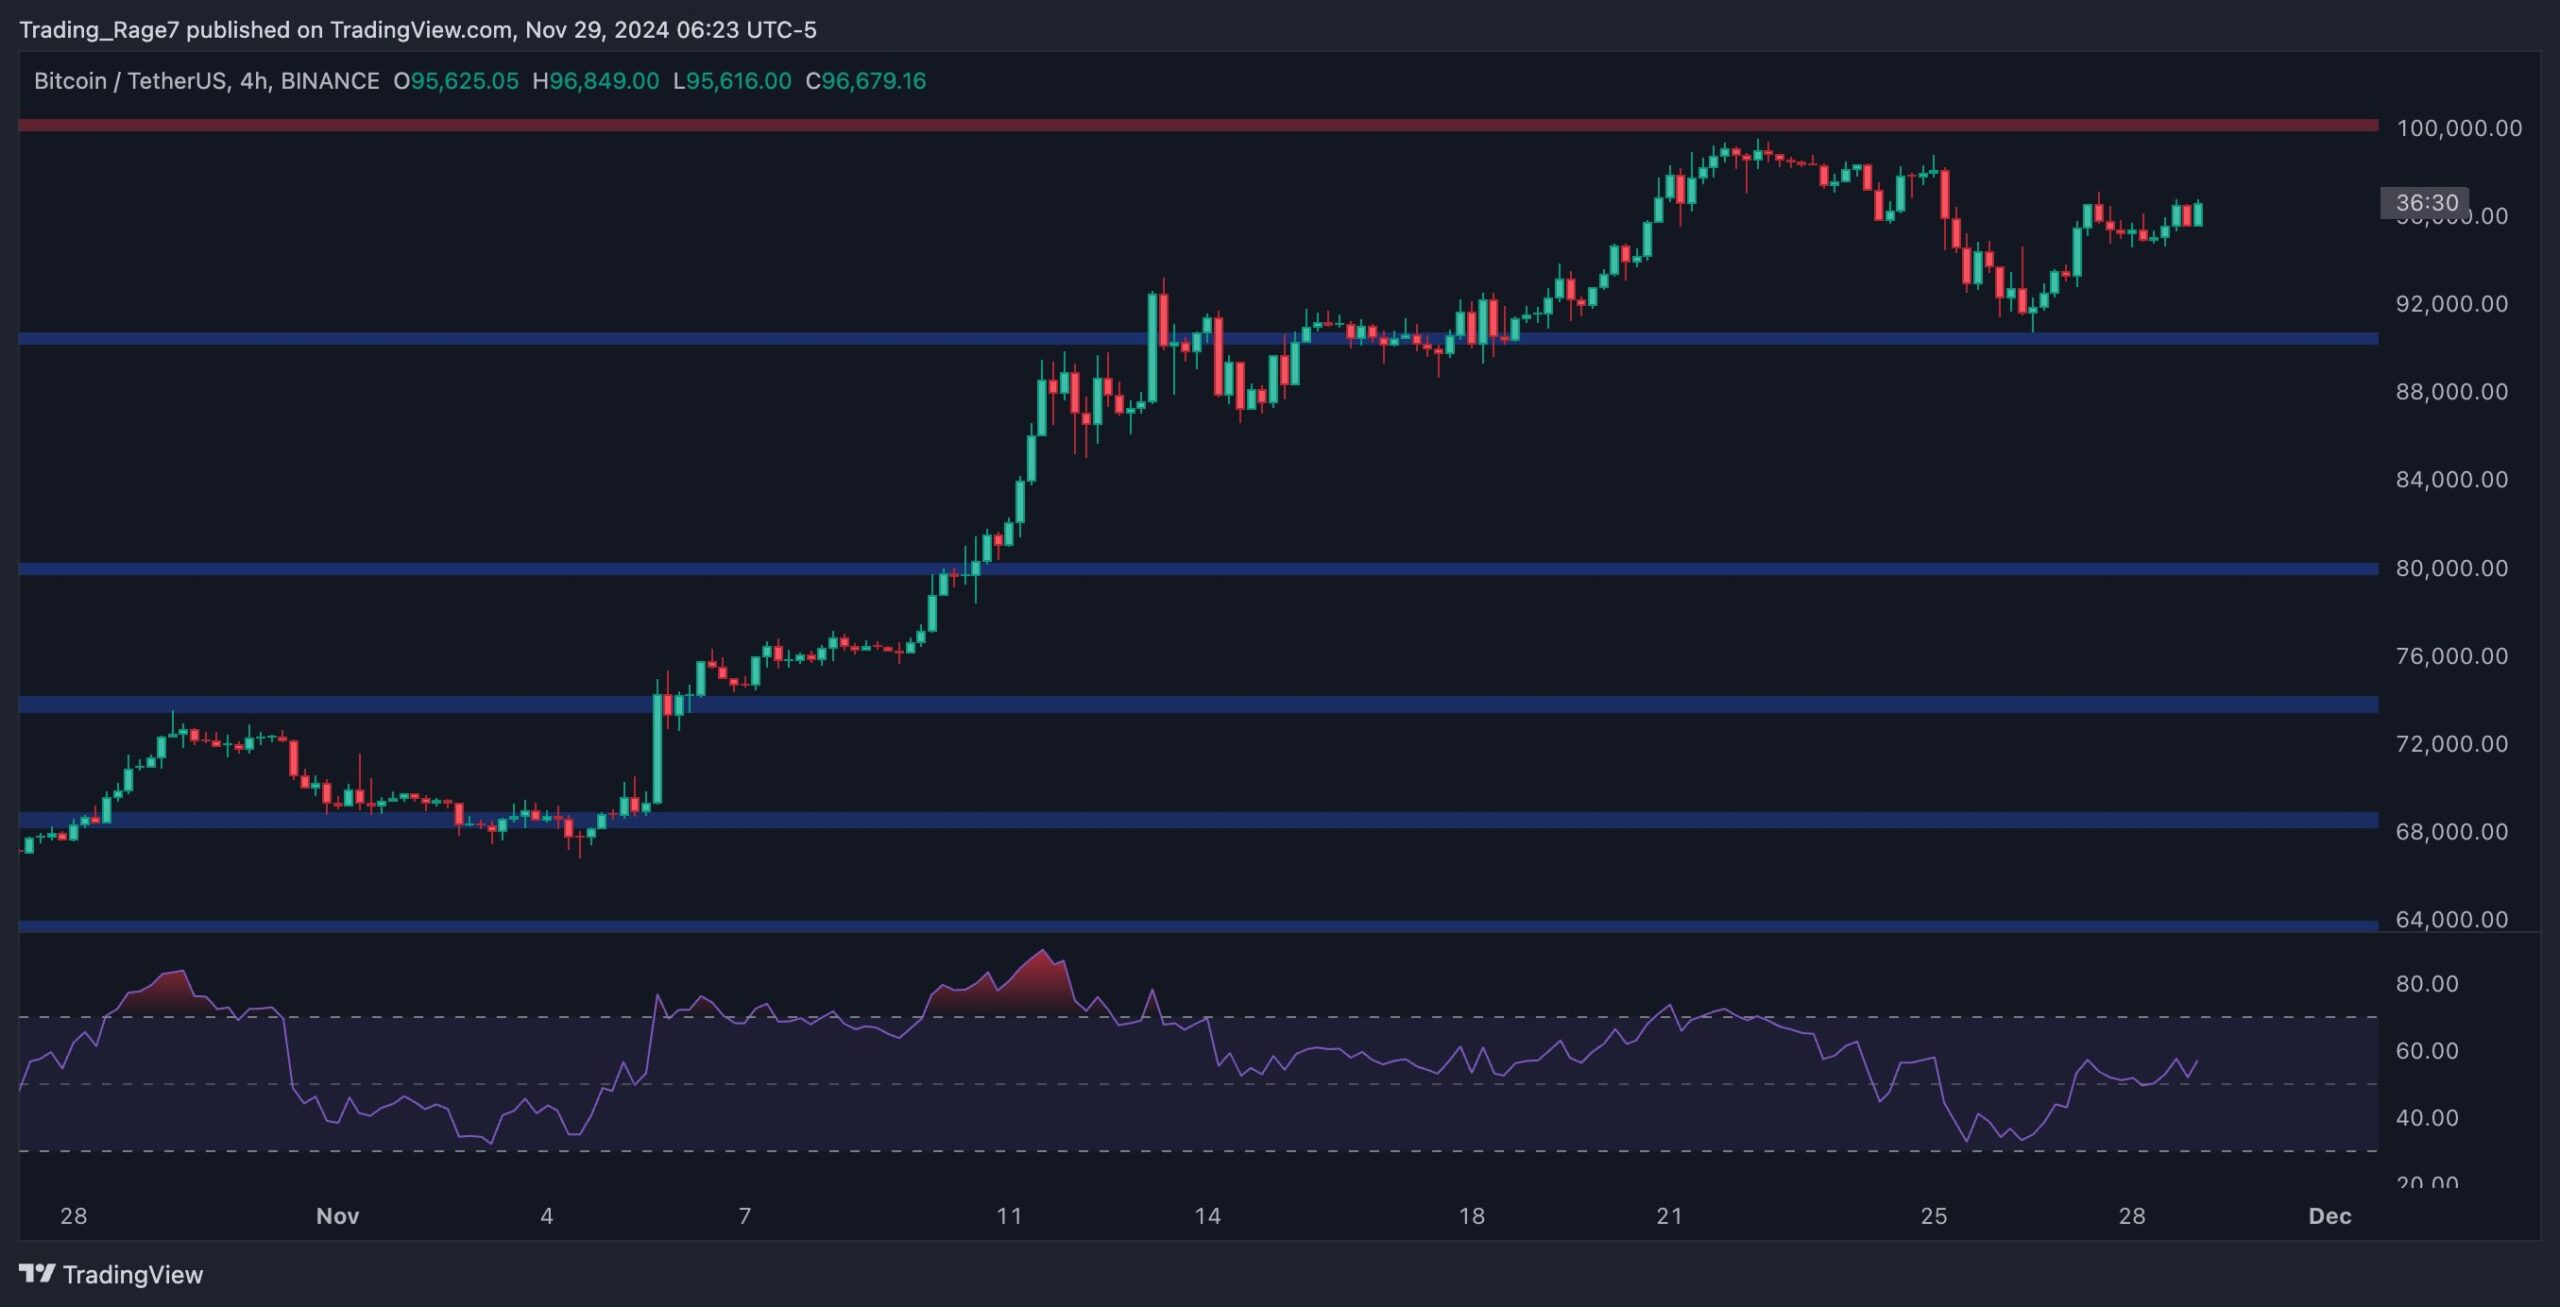
The 4-hour chart gives a clearer picture of recent price action.
The price gradually corrected after moving away from the $99k level, but a V-shaped recovery at the $90k support zone appears to have ended the correction.
As a result, the market is now climbing back towards the $100k level and it could only be a matter of time before BTC reaches a six-figure price.
In-network analysis
Edris Derakhshi (TradingRage)
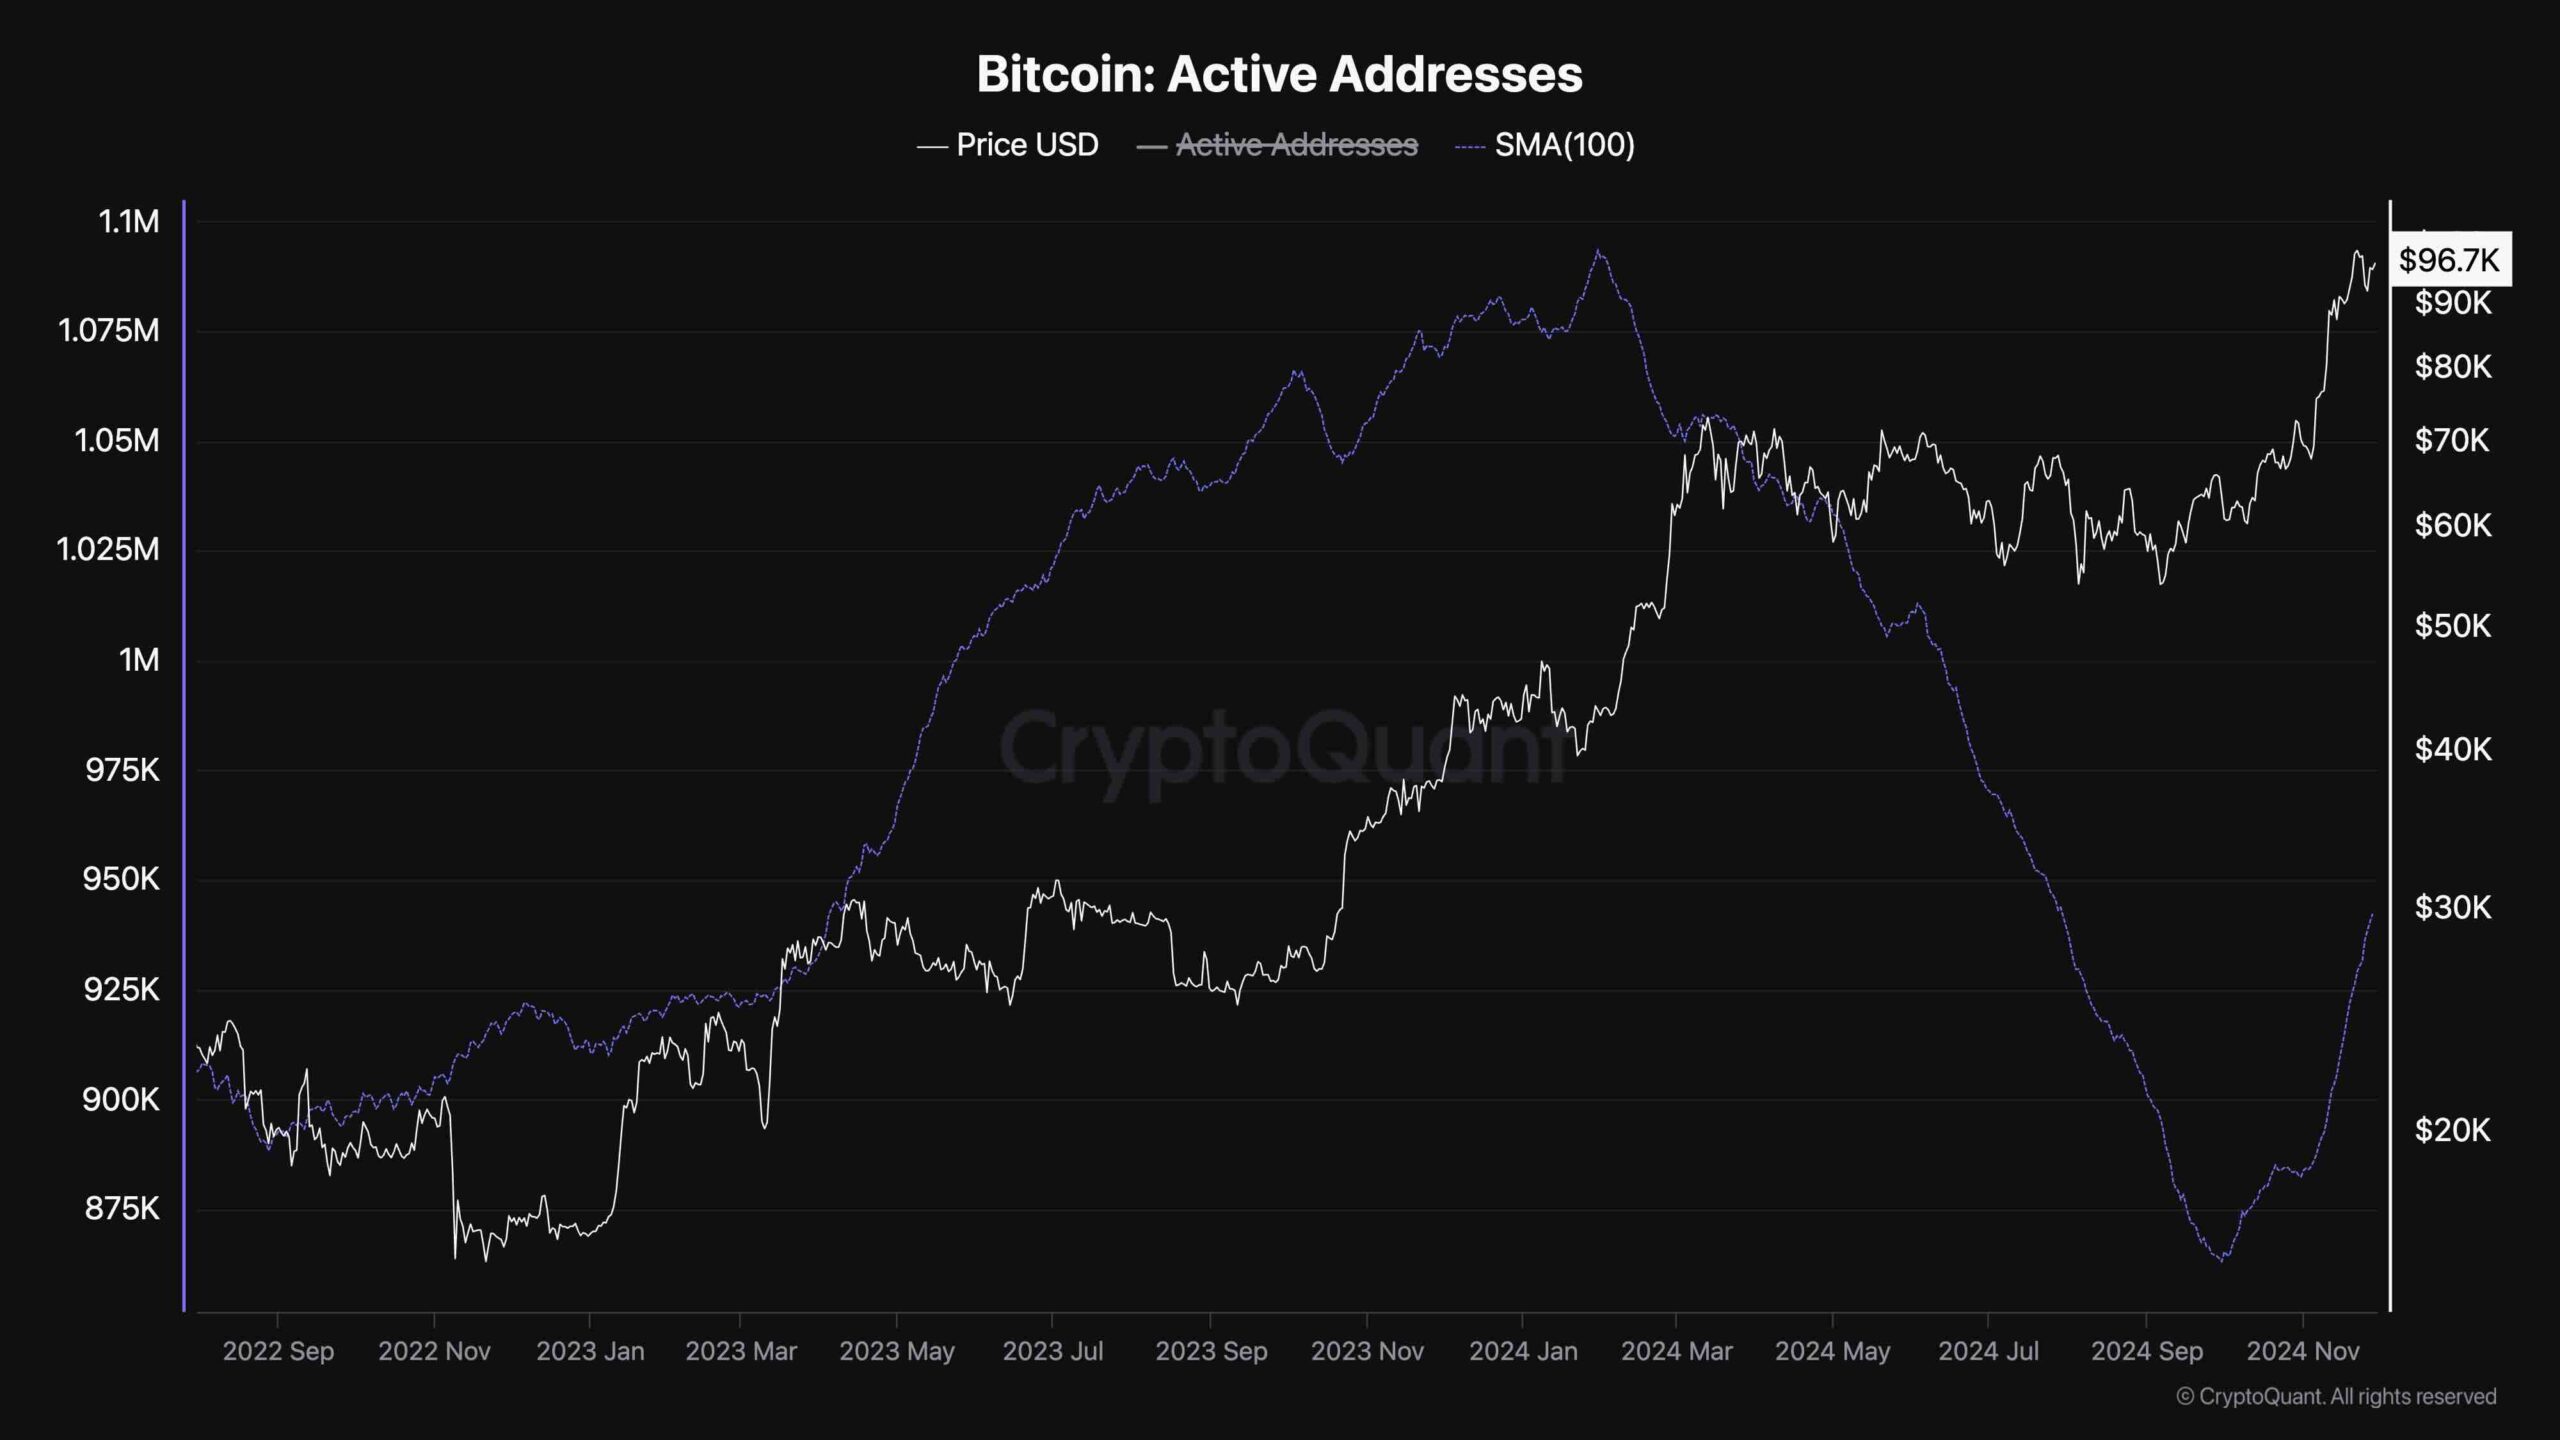
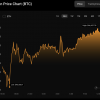
Active addresses (100-day moving average)
The Bitcoin network is built on peer activity, which can be observed because the blockchain system is transparent. Higher network activity could lead to higher BTC prices, as has been the case in the past.
This chart presents the Bitcoin active address metric, which counts the number of addresses sending and receiving BTC.
The number of active addresses has been rising recently as the price reaches new all-time highs. However, it is still much lower than it was previously in 2024, when BTC was trading around $40 thousand. As such, we can expect even higher Bitcoin prices in the coming months if network activity continues to increase.
