BNB price corrected gains below the $600 level. The price now holds key support at $565 and may seek new growth.
- The BNB price began a downward correction from the $620 resistance zone.
- The price is currently trading below $590 and the 100-hour simple moving average.
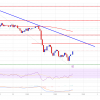
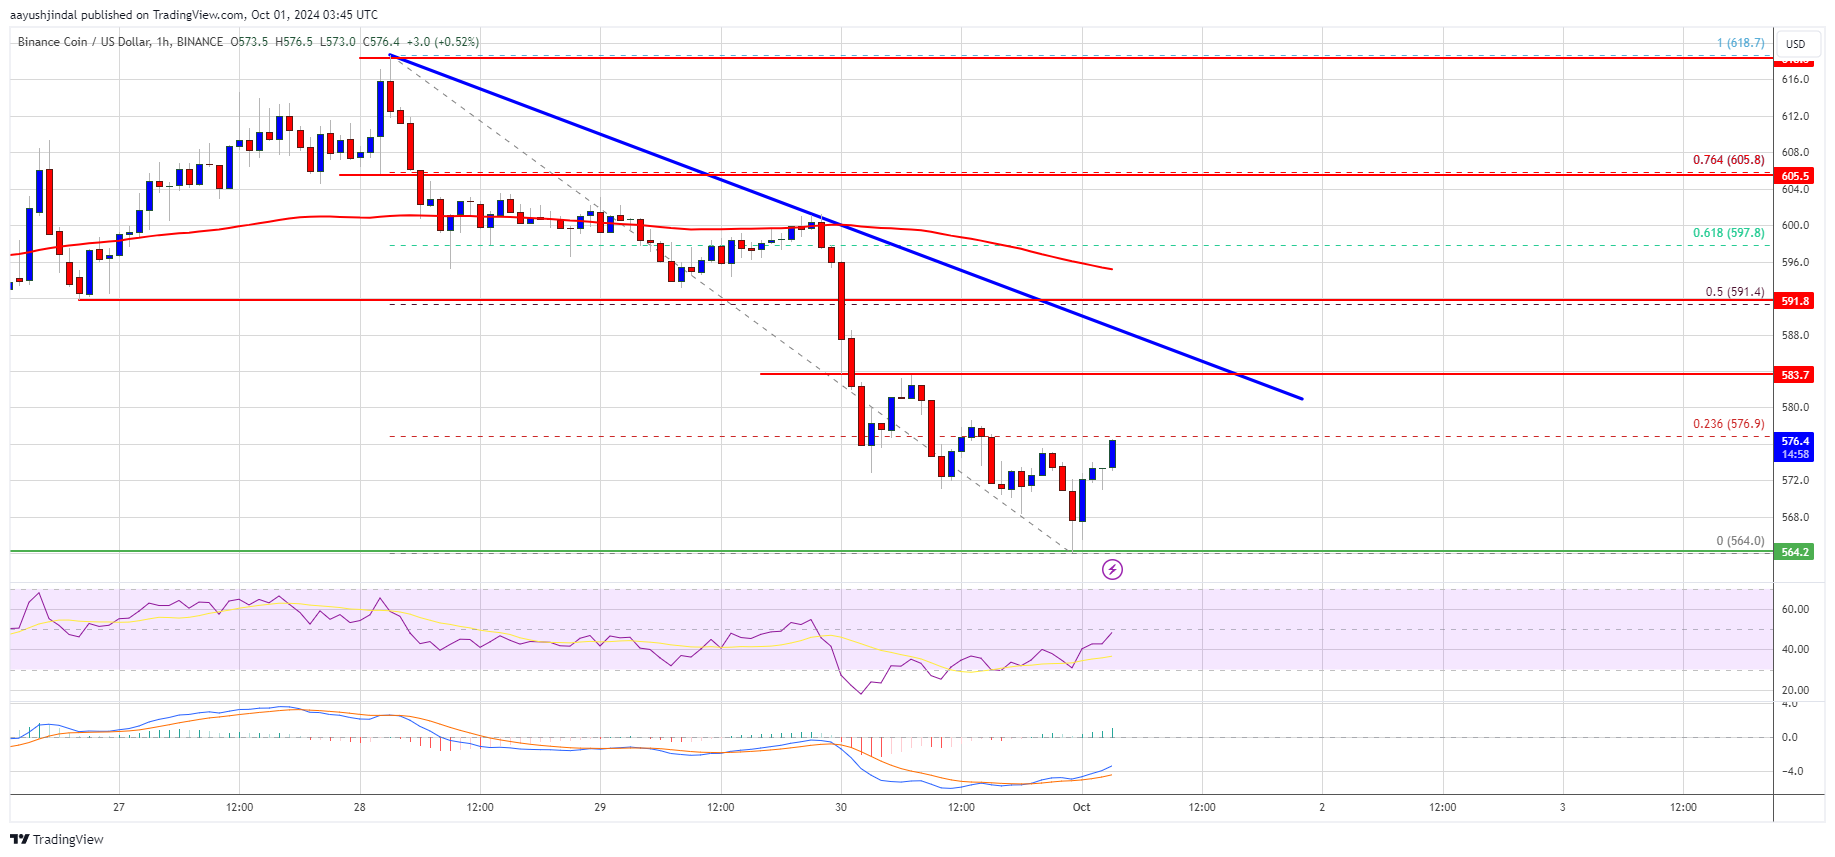
- On the hourly chart of the BNB/USD pair (data source Binance), a key bearish trend line is forming with resistance at $585.
- The pair needs to remain above the $565 level to start fresh gains in the near future.
BNB price continues to rally
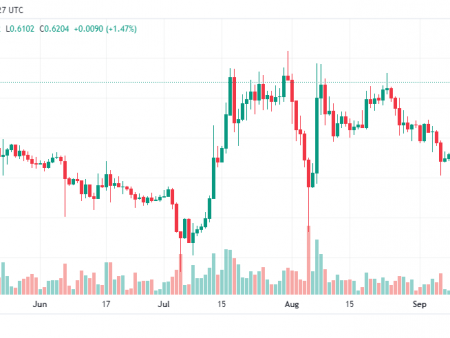
After a significant move higher, the price of BNB saw a rejection pattern near the $620 zone. The high was formed at $618 and the price began a downward correction like Ethereum and Bitcoin.
There was a move below the $600 and $590 levels. The price even dipped below $580 before the bulls moved closer to $565. The minimum was formed at $564, and now the price is rising. It has risen above the $570 level and is now approaching the 23.6% Fibonacci retracement level of the downward move from the $618 swing high to $564 low.
The price is currently trading below $585 and the 100-hour simple moving average. If there is a fresh rise, the price may face resistance near the $580 level. The next resistance is near the $585 level.
A key bearish trend line is also forming on the hourly chart of the BNB/USD pair with resistance at $585. A clear move above the $585 zone could push the price higher. In the said case, BNB price could test $600 or the 61.8% Fibonacci retracement level on a downward move from the $618 swing high to $564 low at $597.
A close above the $600 resistance could set the pace for a larger move towards the $620 resistance. Further growth may require testing of the $650 level in the near future.
More losses?
If BNB fails to break through the $585 resistance, it could start another decline. Initial downside support lies near the $570 level. The next major support is near the $565 level.
The main support is at $550. If there is a break below the $550 support, the price could fall to the $532 support. Any further losses could trigger a deeper decline towards the $520 level.
Technical indicators
Hourly MACD – The MACD for BNB/USD is losing momentum in the bearish zone.
Hourly RSI (Relative Strength Index). The RSI for BNB/USD is currently around the 50 level.
The main support levels are $565 and $550.
The main resistance levels are $585 and $600.