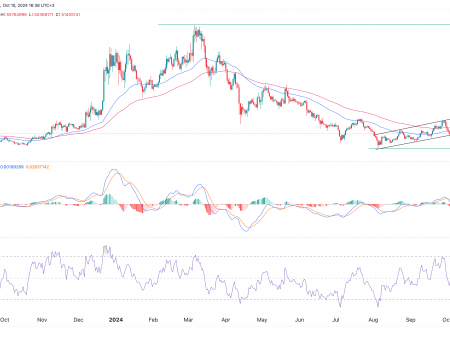
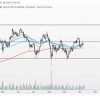
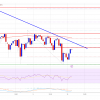
Over the past few days, XRP has demonstrated resilience, and its price action indicates a continued bullish trend. This rise is charted through a series of rising lows, a positive sign for investors. The cryptocurrency has been treading carefully above a vital support level of $0.60, which has historically served as a springboard for bullish moves; However, XRP bulls were unable to push up the price of the cryptocurrency.
As XRP rides the currents of market sentiment, it faces a local resistance level around $0.65. This price has proven to be a difficult barrier to overcome, and several attempts have resulted in minor pullbacks. However, the resistance at the support level suggests that bullish momentum still persists and the asset can potentially overcome this resistance.
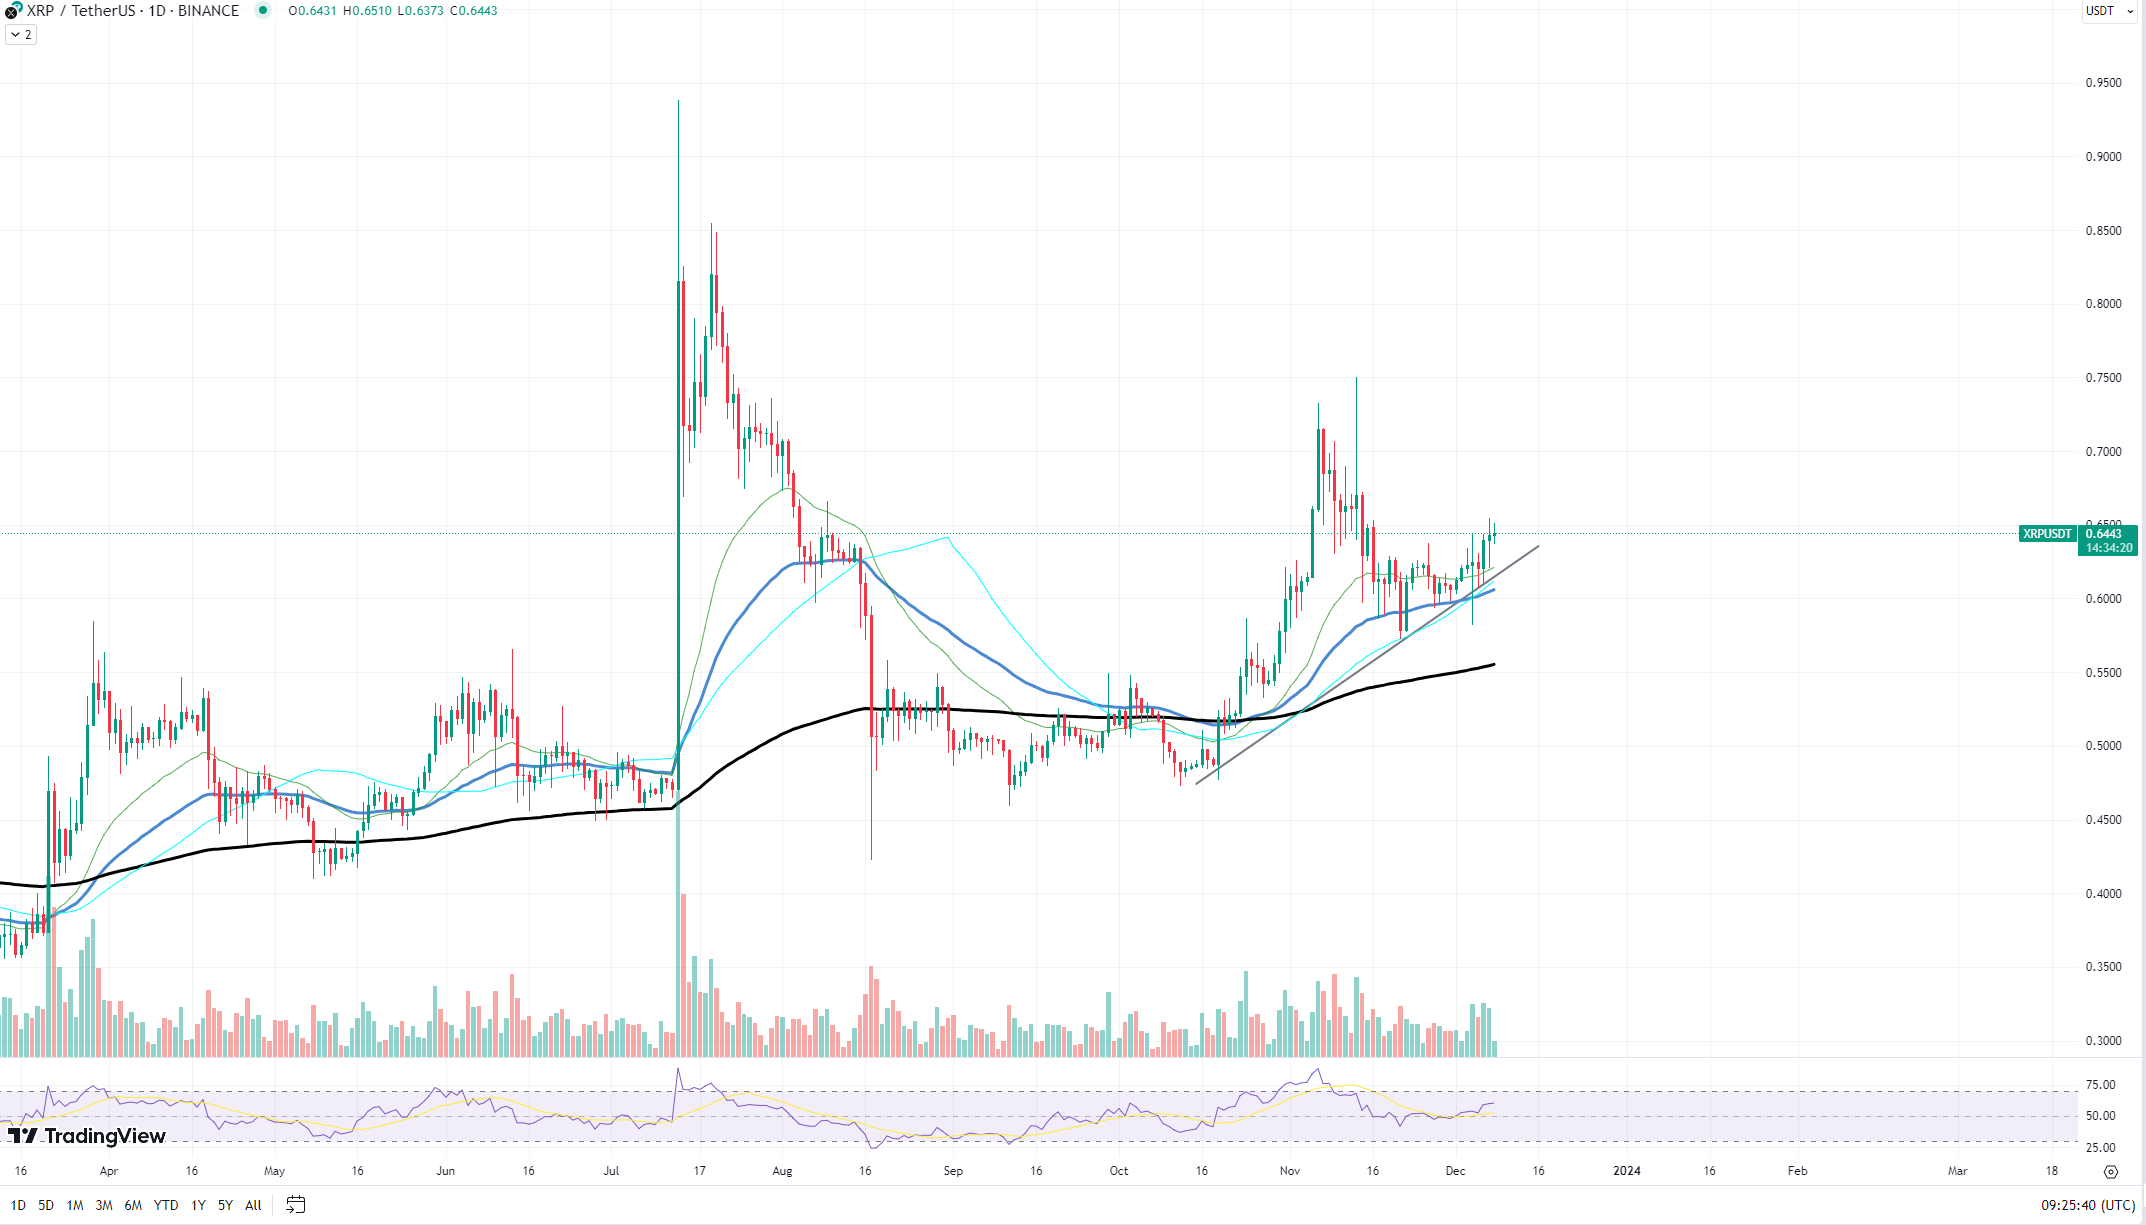
The price of $0.73 will most likely become the next major resistance level for the asset. This threshold is significant for several reasons. Firstly, it represents a key psychological threshold and a price at which XRP has previously encountered substantial sales volume.
Secondly, achieving this target would mean surpassing the previous price reversal point, a strong indicator that long-term market sentiment is turning in favor of the bulls.
Moving averages provide additional information on XRP price action. The 50-day exponential moving average (EMA), represented by the blue line, has served as dynamic support for the asset’s price, propelling it towards higher levels. The 200 day EMA, represented by the black line, lies just below the current price, reinforcing the $0.60 level as a strong support zone. This alignment of the moving averages below the price is a bullish signal, often interpreted as a “golden cross” in technical analysis.
The potential move towards $0.73 also aligns with Fibonacci retracement levels, a common tool used by traders to predict areas of interest. Given the asset’s recent swings, the $0.73 level coincides with a key Fibonacci level that has historically acted as a pivot point for the price of XRP.