Disclaimer: The opinions expressed by our writers are their own and do not represent the views of U.Today. The financial and market information provided on U.Today is for informational purposes only. U.Today is not responsible for any financial losses incurred when trading cryptocurrencies. Do your own research by contacting financial experts before making any investment decisions. We believe all content is accurate as of the date of publication, but some offers mentioned may no longer be available.
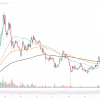
Shiba Inu (SHIB) has been making headlines recently, and rightly so. The meme coin has joined the market-wide rally and is currently trading at $0.00000759. While this is a positive sign for SHIB holders, the asset is approaching a critical resistance level: the 50-day exponential moving average (EMA).
Historically, the 50 EMA has acted as a strong resistance or support level for several assets, and SHIB is no exception. If the asset manages to break above this level, it could very well reach the long-awaited threshold of $0.000008. However, SHIB’s low trading volume suggests this rally might not have the momentum to sustain an advance.
Adding another layer of complexity to SHIB price action is the Relative Strength Index (RSI), which recently crossed the value of 50. This is generally considered a bullish signal, indicating that the asset is gaining strength. But it is essential to note that the RSI alone cannot be relied on to make investment decisions; It’s simply one piece of the puzzle.
The market-wide rally has been a boon for many cryptocurrencies and SHIB appears to be taking advantage of this positive sentiment. However, SHIB’s low volume profile hints at a lack of strong buying interest, which could make it difficult for the asset to maintain its upward trajectory.
Solana’s dominant wave
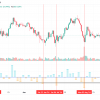
Solana (SOL) has been making headlines with its recent price performance, currently trading at $24.41. The asset has been subject to a brief squeeze, leading to a rapid and dominant rise in value.
The short squeeze phenomenon occurs when an asset that has been heavily shorted experiences a sudden increase in price, forcing short sellers to buy back their positions at a loss, driving the price even higher. In the case of Solana, this has led to a notable rebound in its market value, taking many by surprise.
This rise comes at a time when Bitcoin has also been advancing, recently reaching the $28,000 mark. The positive sentiment around Bitcoin often extends to altcoins, and Solana appears to be one of the main beneficiaries of this trend. The correlation between Bitcoin’s rise and Solana’s performance cannot be ignored as investors look for high-yield alternatives to diversify their portfolios.
Technically speaking, Solana has broken through several resistance levels and shows no signs of slowing down. The volume of the asset is also increasing, indicating strong market interest. The next major milestone for Solana would be to maintain this momentum and possibly aim for new all-time highs.
However, it is essential to exercise caution. While the short-term crisis has provided a significant boost, it is crucial to consider that such explosive growth may not be sustainable in the long term. Investors must keep an eye on market indicators and trends to make informed decisions.
Ethereum faces opposition
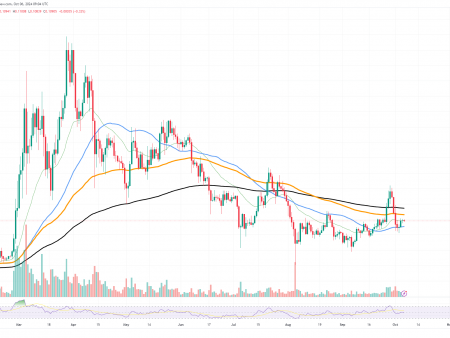
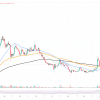
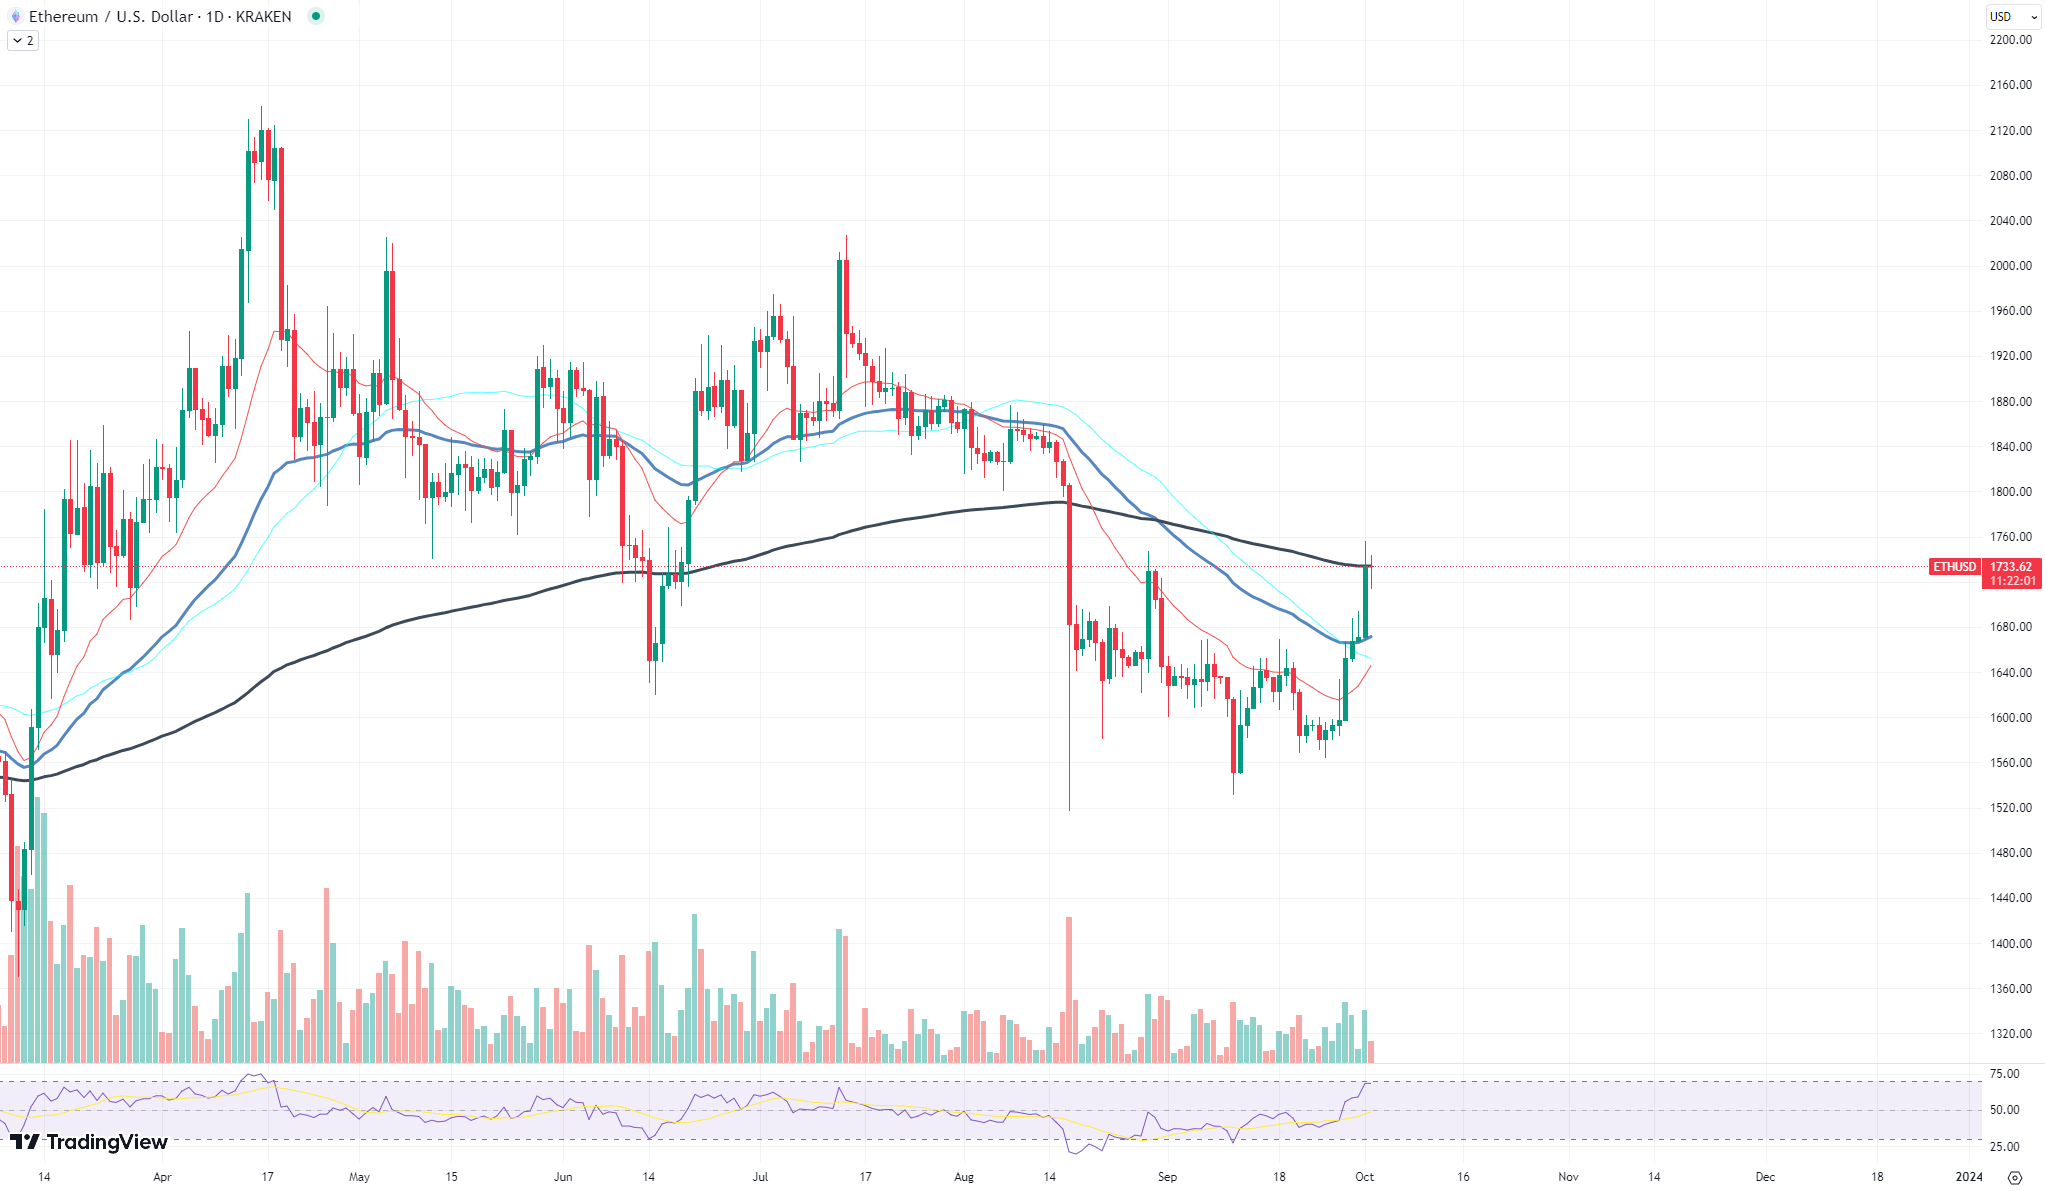
Ethereum has been making headlines with its recent bullish trends, but it seems like the asset has delivered on its promise, at least for now. After a promising upward trajectory, Ethereum has hit a major roadblock in the form of the 200 exponential moving average (EMA), a widely watched technical indicator used by traders to identify long-term trends.
According to the latest data, Ethereum is trading at approximately $1,736.35 USD. While the asset has shown notable resistance in rising from lower levels, it has failed to break above the 200 EMA, which is often considered a critical resistance or support point depending on the asset’s position in relation to it.
Failure to break above this level could be a sign of caution for both traders and investors. The 200 EMA serves as a litmus test for the asset’s long-term viability and strength. Failure to make a breakthrough could mean that Ethereum could need further bullish momentum to maintain its upward trajectory.
This resistance level becomes even more crucial when considering the broader market dynamics. With Bitcoin and other altcoins showing signs of strength, Ethereum’s inability to break this resistance could signal a period of consolidation or even a possible slowdown.