Three Metrics DeFi Traders Can Watch to Spot the Next Crypto Bull Market
TVL, fee income, and wallet activity are just three metrics that investors can use to assess the health of the DeFi sector.
Market analysis
The decentralized finance (DeFi) market has been one of the most interesting and volatile sectors of cryptocurrencies outside of Bitcoin (BTC). In 2020, the DeFi sector experienced a bull market where the total value locked (TVL) in decentralized finance protocols increased from $1 billion to over $100 billion. However, the DeFi market has also been prone to major corrections. In 2021, the DeFi market experienced a correction that saw TVL drop from $100 billion to $40 billion.
Despite the volatility of the DeFi market, traders have ways of noticing when the niche crypto sector begins to show sustained bullish momentum. Three of the most important metrics to look at are TVL, a platform’s fee income, and the number of non-zero wallets containing tokens.
Let’s dig a little deeper to explore how these metrics can be used to assess the health of the DeFi sector.
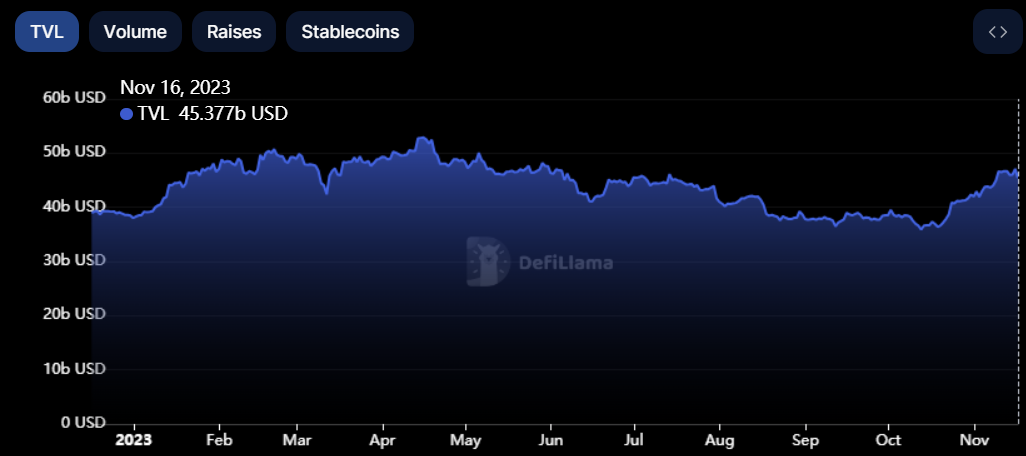
Increases in total value locked
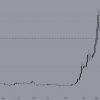
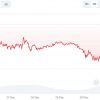
TVL is one of the most used metrics to measure the overall health of the DeFi ecosystem. TVL represents the total amount of cryptocurrency assets locked in DeFi protocols. When TVL increases, it suggests greater demand and usage for DeFi services, which may signify a bull market.
While the current TVL is slightly below the 2023 high set on April 15 of $52.9 billion, it has increased since the beginning of the year. Since January 1, the TVL across the entire cryptocurrency market has risen by $7 billion, eclipsing $45 billion.
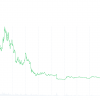
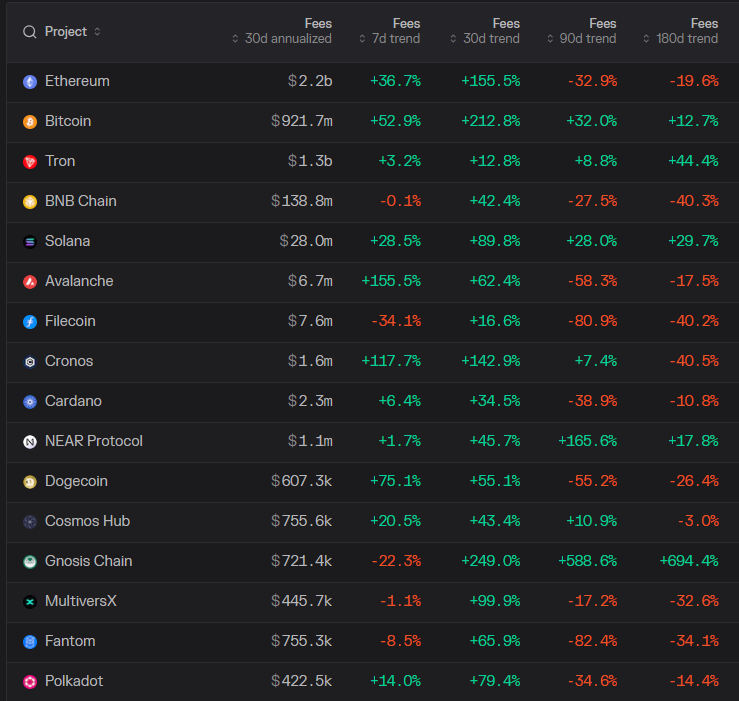
Rising fee revenue points to increased usage and interest
Protocol fees measure the amount of fee revenue blockchains receive for completing transactions. Layer 1 blockchains are a key part of the DeFi ecosystem as they enable the creation of decentralized applications (DApps) in which users can interact without a centralized intermediary.
When layer 1 fees increase, it suggests that there is increasing interest in DeFi and that merchants are using DApps to interact with blockchains. Over the past 30 days, the top 16 Layer 1 blockchains by market capitalization have shown a positive increase in fees. The total 30-day fee charged for Ether (ETH) exceeds $2.2 billion when annualized.
Related: Break into Liberland: Dodge guards with inner tubes, decoys and diplomats
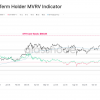
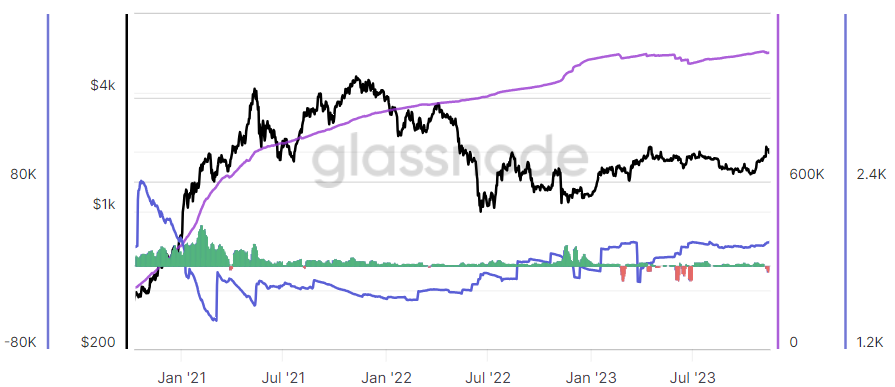
Non-zero DeFi wallet addresses increase
The number of non-zero addresses is a good indicator of the number of people actively participating in cryptocurrencies. When the number of non-zero addresses increases, it suggests that there is increasing demand, which can be a sign of a bull market.
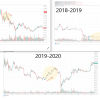
Non-zero addresses are a typically reliable indicator of demand, as users are likely to only hold a crypto token if they believe its value will appreciate or they will actively use a protocol. Isolating statistics from the entire crypto market to focus on DeFi tokens, the number of non-zero addresses reached an all-time high on November 8 of 1.1 million addresses. Looking at November 8, 2020, there were only 267,180 non-zero wallet addresses.
Related: Solana (SOL), Avalanche (AVAX), and dYdX Produce Double-Digit Gains as Bitcoin Reclaims $37,000
The DeFi market has recovered and evolved since the Terra Luna implosion, but it is also volatile, so it is important to carefully consider on-chain metrics and other macro factors that can help identify bull markets.
By looking at these metrics, traders can better understand the overall health of the DeFi market and possibly get early signals about the emergence of a new bull market.
This article does not contain investment advice or recommendations. Every investment and trading move involves risks, and readers should conduct their own research when making a decision.
Add reaction