Polkadot price was the worst-performing large-cap cryptocurrency in 2024, but a rare chart points to a strong rebound in 2025.
Polkdaot (DOT) is down more than 15% this year, while other leading coins such as Bitcoin (BTC), Solana (SOL), and Binance Coin (BNB) have soared to their all-time highs.
The decline in the coin’s performance occurred even despite the successful launches of its network. For example, Hydration, the leading decentralized exchange in the Polkadot ecosystem, processed a record volume of over $124 million in December.
Polkadot’s digital trading card game NFL Rivals has gained popularity among NFT traders. Meanwhile, Bifrost, a liquid staking network on Polkadot, has amassed over $15.1 million in assets, and Moonwell, a lending protocol, has nearly $200 million in total value locked.
On-chain data also shows that the number of transactions on Polkadot continues to rise, reaching a record high this week.
Even though Neuroweb transactions are disabled for this week’s V8 update…
Monthly transactions across the entire Polkadot network will reach a new all-time high. pic.twitter.com/bHCQLW011u
— Jay Kraunna 🐂⭕️ (@GldnCalf) December 30, 2024
Polkadot saw 8.52 million transfers in December, down slightly from 9.11 million in November, according to The Block. However, the volume of transfers in the fourth quarter reached a record high, indicating strong activity on the network. Similar growth was observed in the relay chain, where both active addresses and transmissions increased.
Polkadot also offers one of the highest yields among major cryptocurrencies, with a 12% yield and a 25.13% staking ratio. These strong fundamentals could support a price recovery in the coming months.
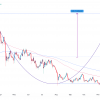
Polkadot price has formed a descending wedge
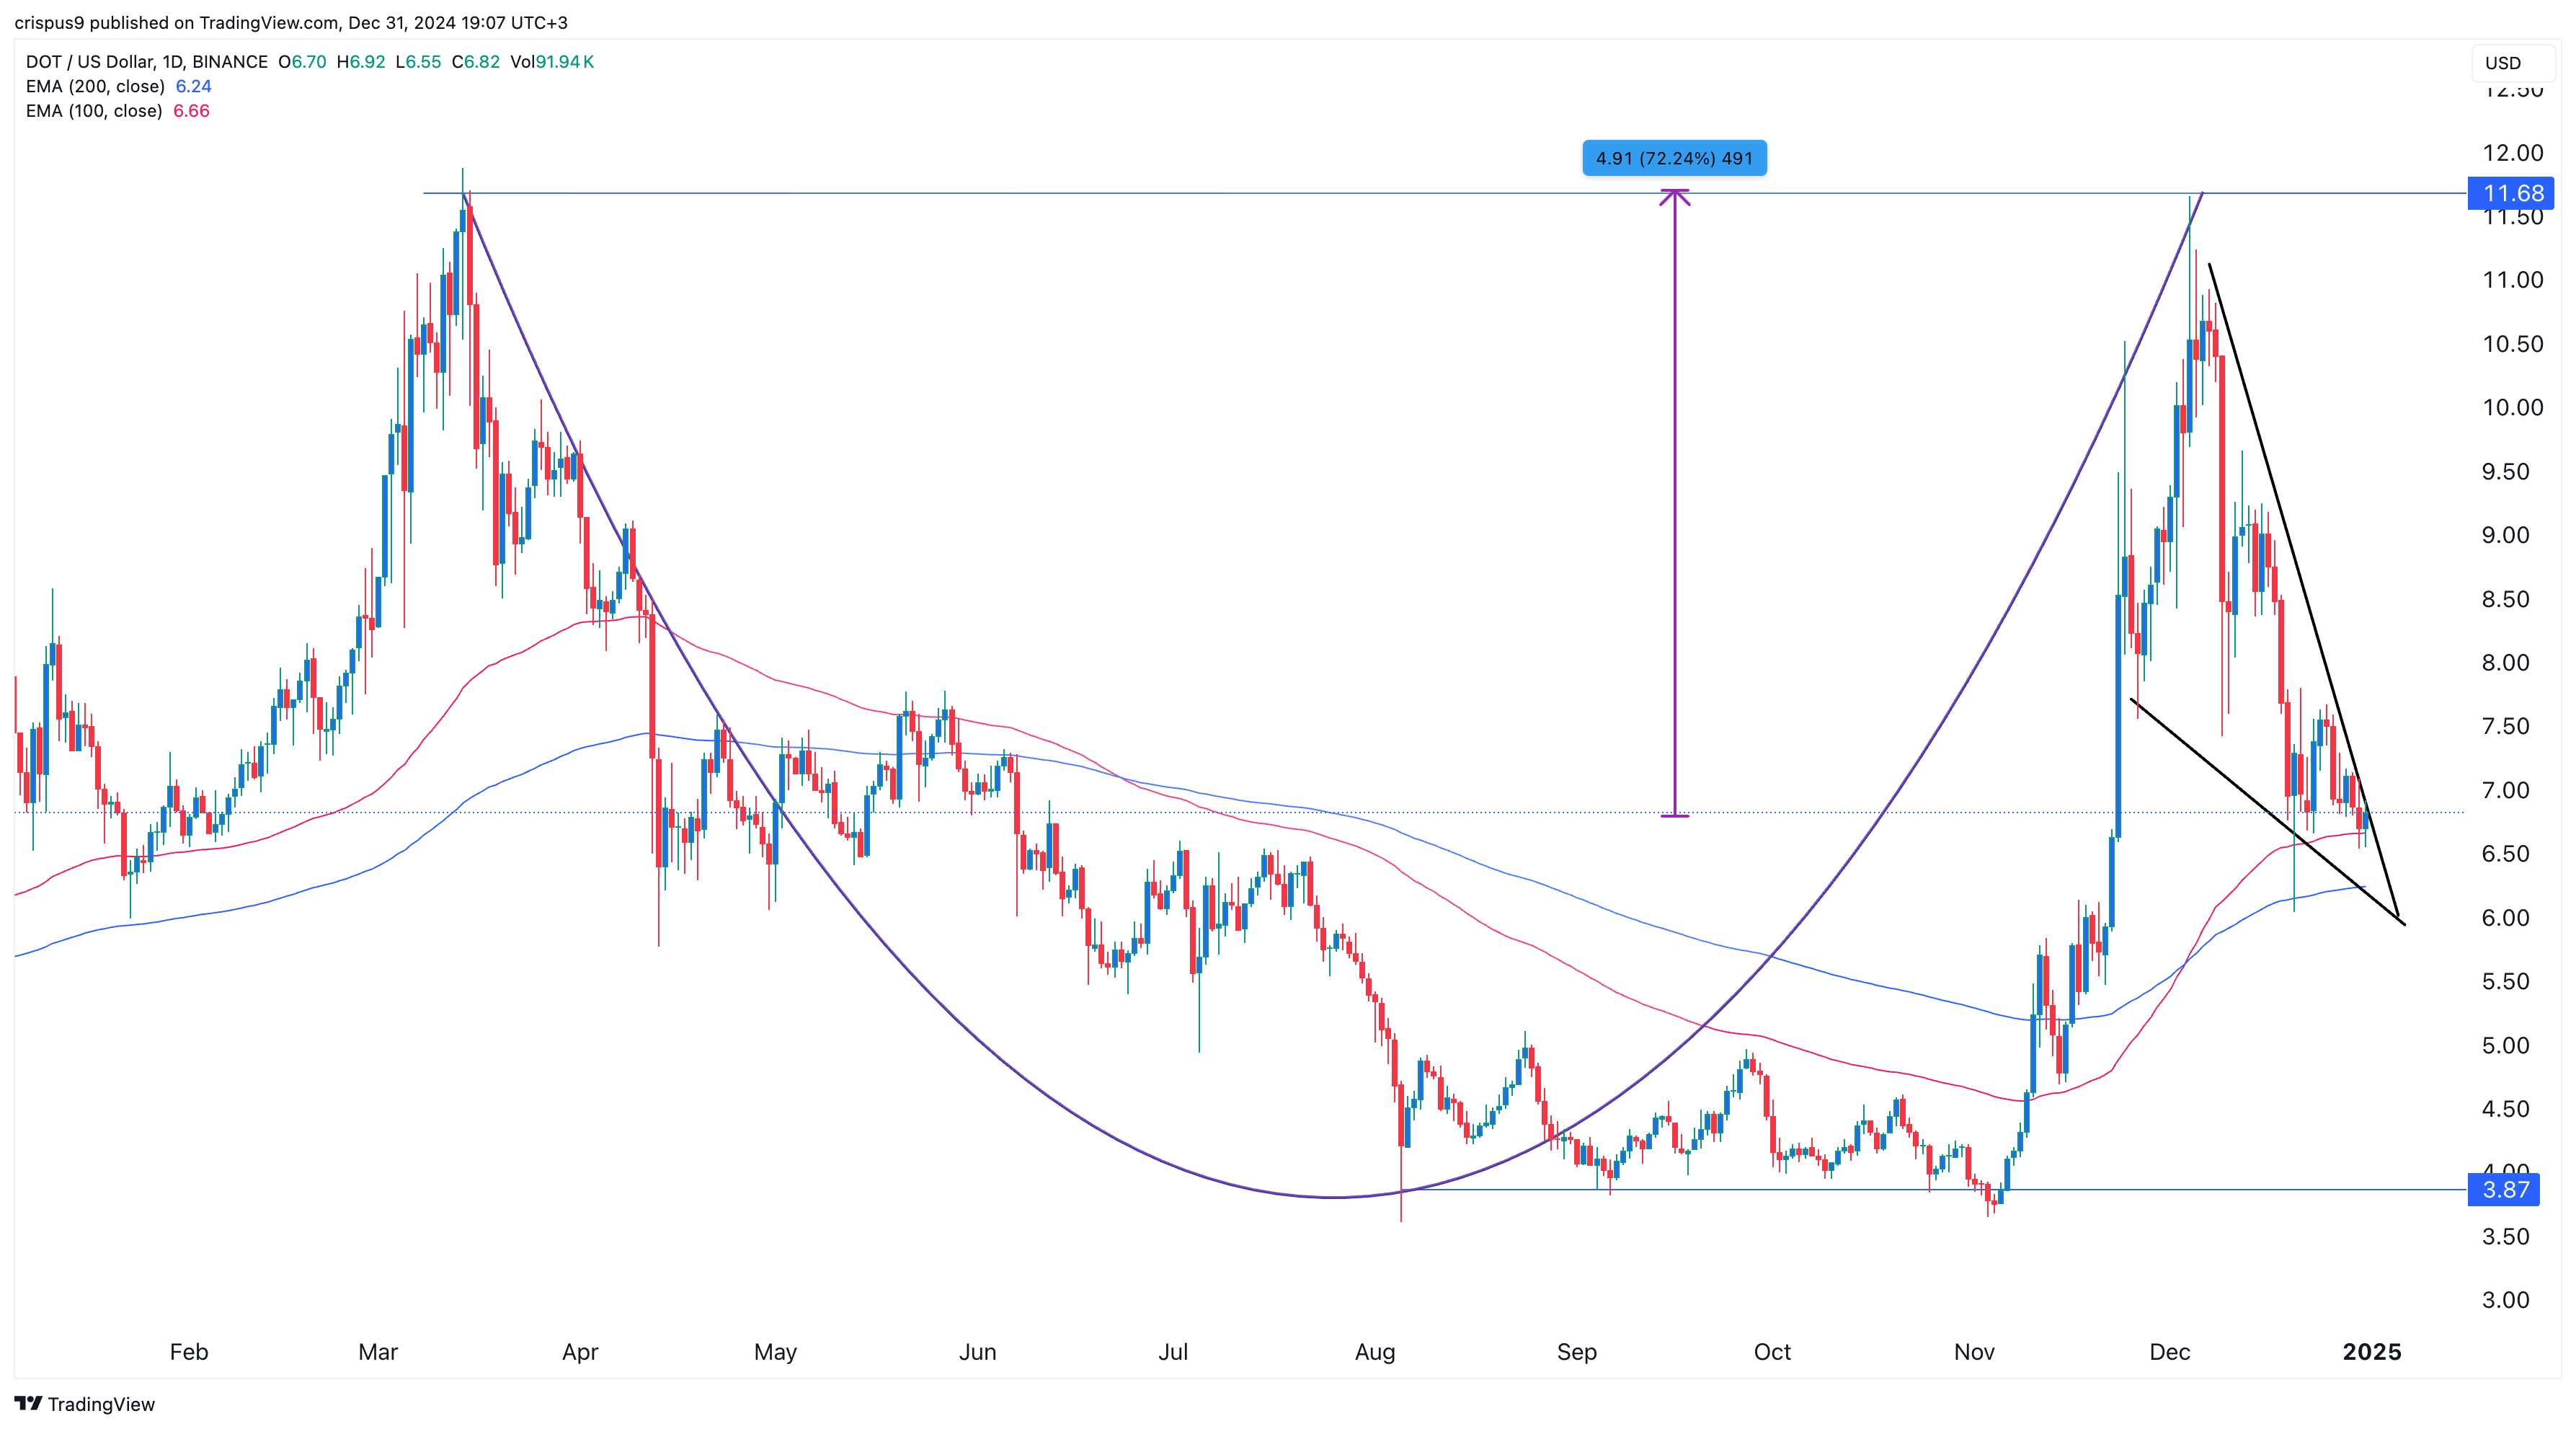
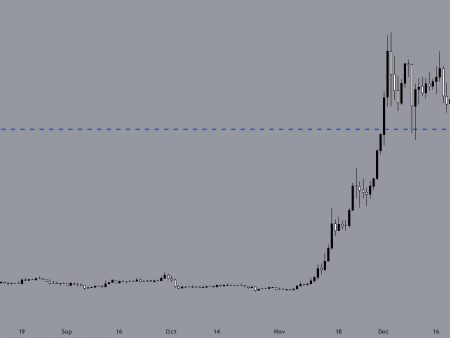
The daily chart shows that the price of DOT has declined over the past few weeks, falling from this month’s high of $11.70 to the current $6.8.
Polkadot remained above the 100-day and 200-day exponential moving averages, signaling positivity. He also formed a “cup and handle” figure, where the continuing retreat represents the handle.
Additionally, a descending wedge pattern, a well-known bullish reversal indicator, emerged. As the two wedge lines approach confluence, price is likely to make a bullish breakout. This could push DOT to a year-to-date high of $11.68, up about 72% from current levels.
