Ripple is currently experiencing a low volatility phase, with its price hovering around the key $2-$3 range. This period of consolidation suggests market indecision, and a breakout will likely determine XRP’s next medium-term trend.
XRP Price Analysis
Author: Shayan
Daily chart
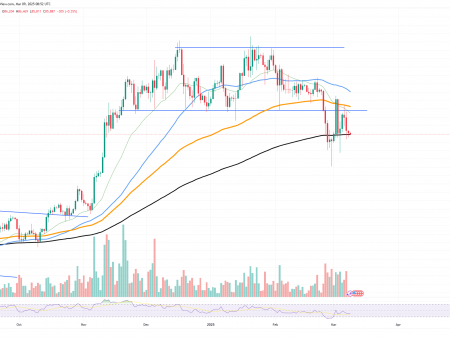
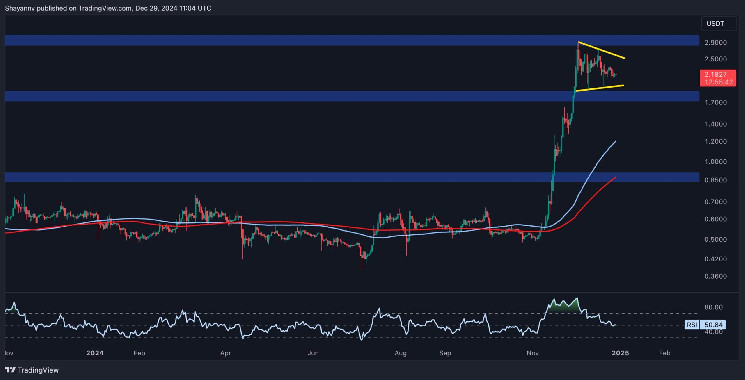
Ripple’s price has recently been confined to the $2-$3 range, characterized by low volatility and muted trading activity. This consolidation reflects the cautious state of the market as participants wait for the final breakout to signal the next directional move.
The cryptocurrency is currently pegged at the $2 support zone, a level backed by the historical value of the previous swing high and demand concentration. It acts as a decisive barrier, stopping further downward movement and keeping Ripple within its consolidation range.
In addition to the bullish outlook, the RSI indicator has stabilized around 50, indicating a balance between buyers and sellers. This arrangement sets the stage for bullish momentum with the potential for a breakout above the $3 resistance. If this happens, Ripple could begin a medium-term uptrend.
4 hour chart
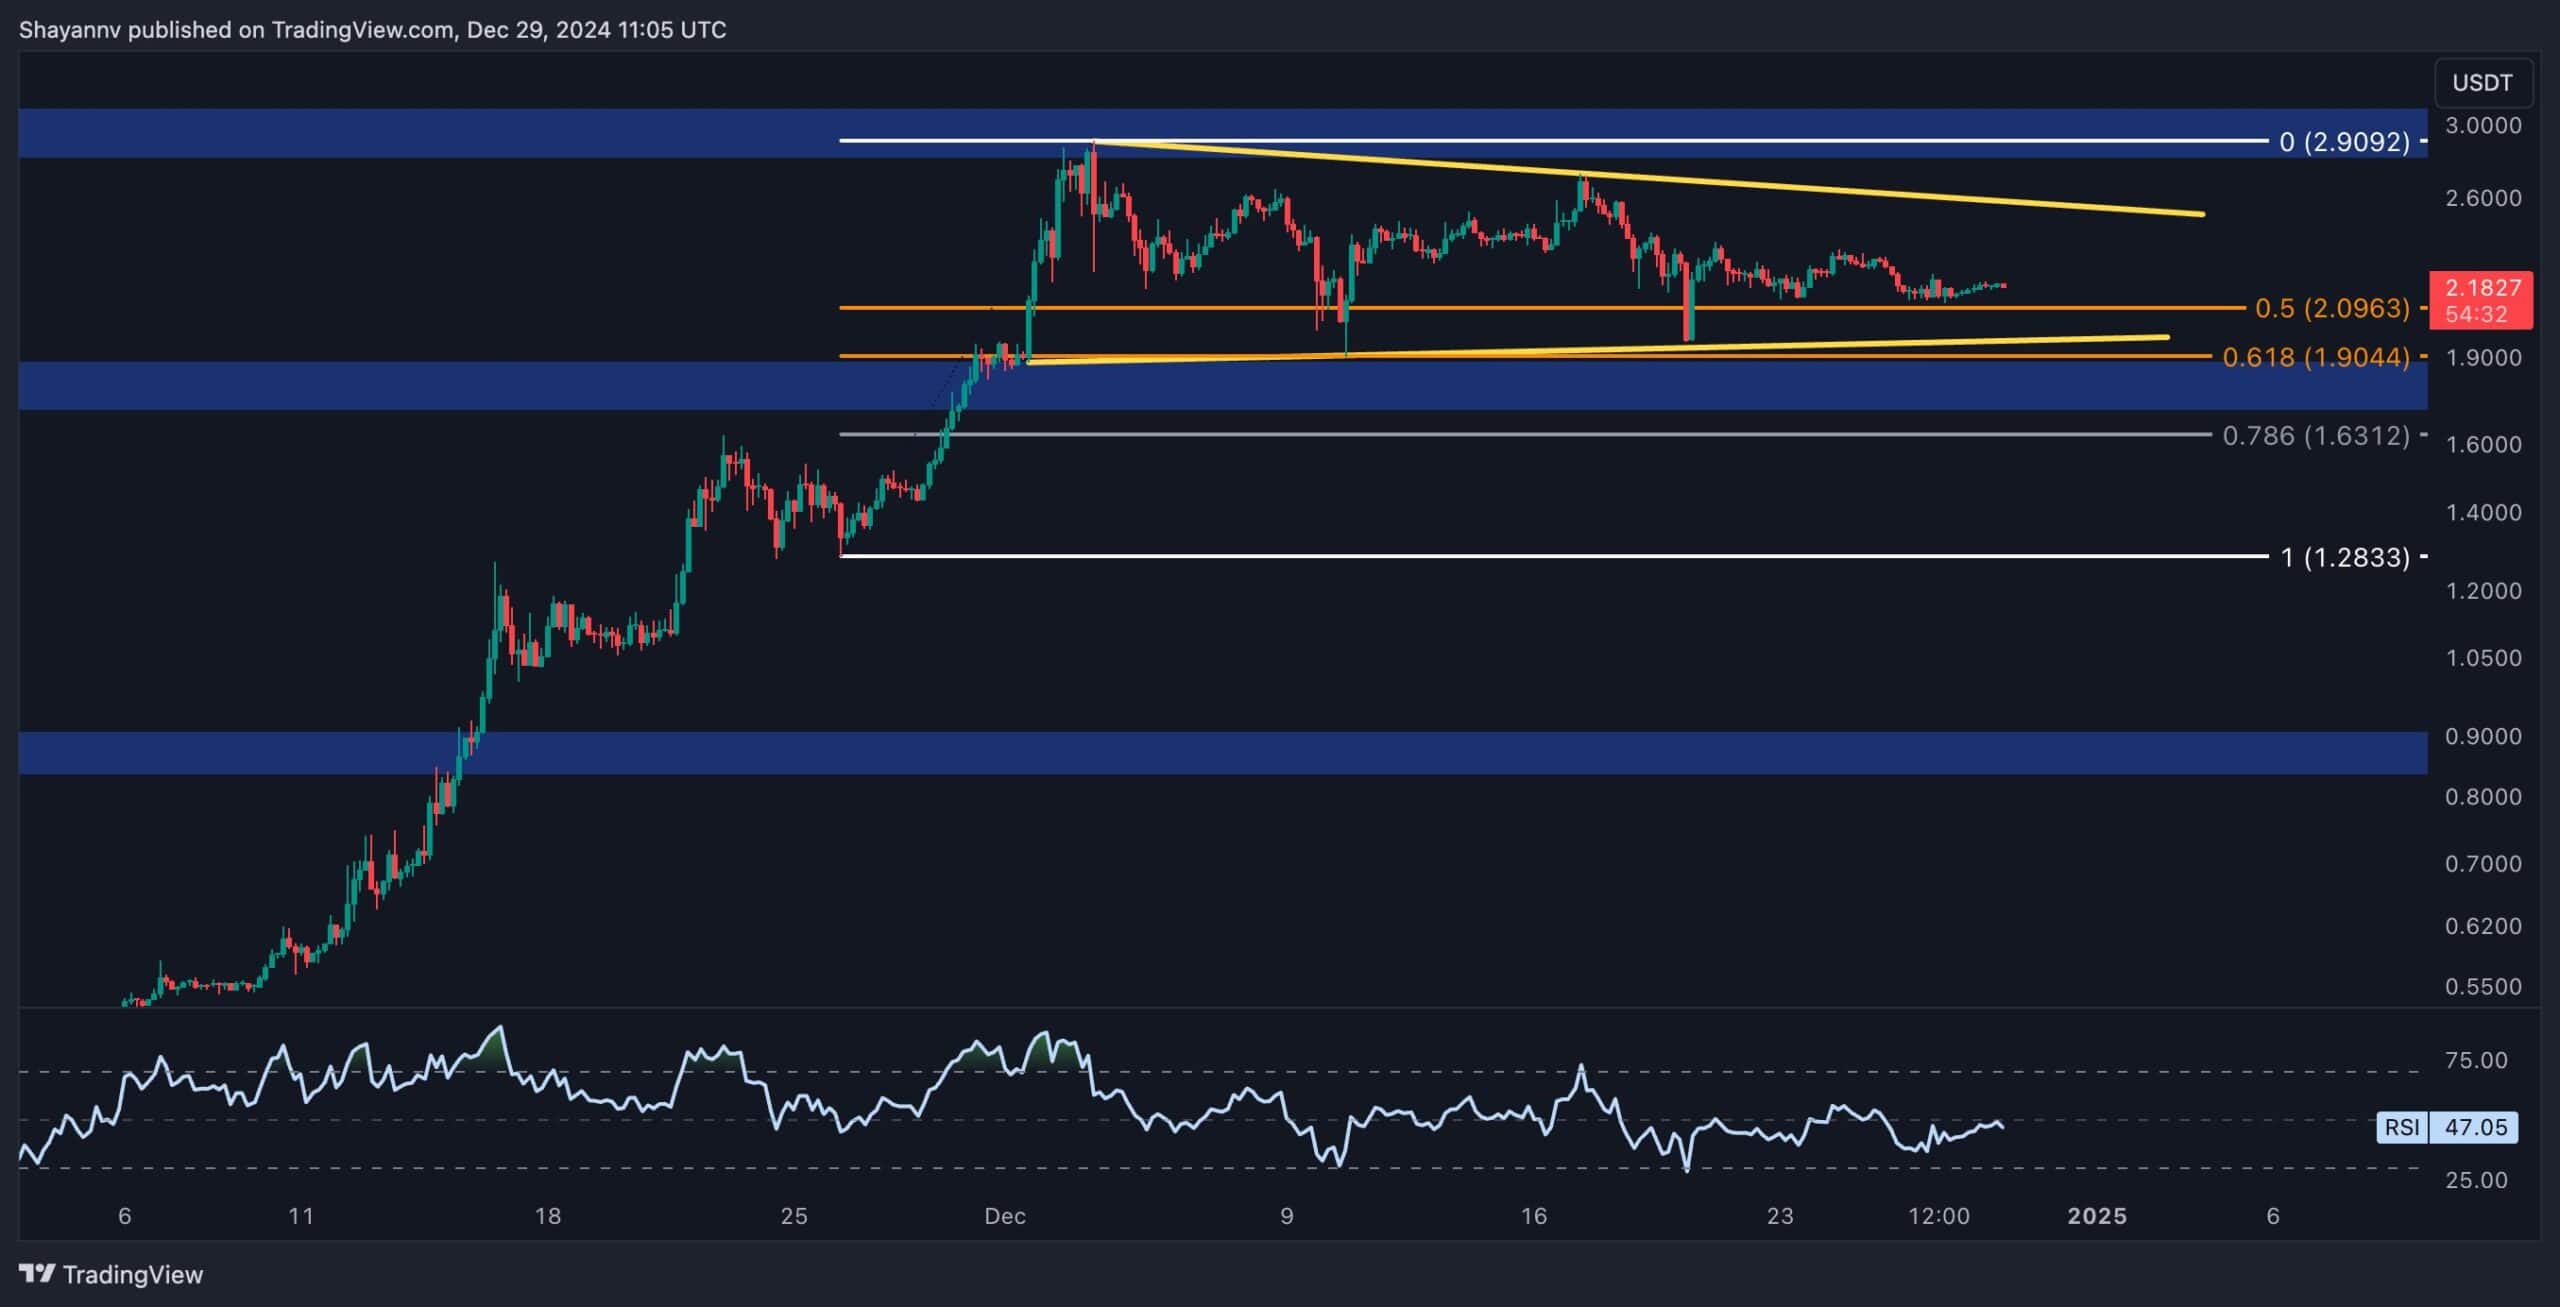
On the 4-hour timeframe, Ripple fluctuated within a falling wedge pattern, a formation that is typically associated with bullish breakouts.
The price is testing the lower border of the wedge near the critical support zone at $2, where increased buying activity is expected. This zone is further strengthened by significant Fibonacci retracement levels of 0.5 ($2) to 0.618 ($1.9), highlighting its importance as a strong support area.
Over the medium term, the cryptocurrency is expected to maintain consolidation within the wedge, holding above these key Fibonacci levels. A bullish breakout above the upper wedge boundary could push the price towards the $3 resistance, setting the stage for further gains.
Conversely, failure to hold the $2 support could result in a bearish breakout, potentially pushing the price towards the $1.5 threshold, which represents the next critical support level.
