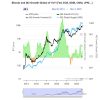
Uniswap’s daily trading volume has seen significant fluctuations throughout 2024, peaking in early September when it briefly topped $8 billion.
This peak likely signaled an important market event or a surge in traders’ interest. Following this surge, trading volumes stabilized but continued to exhibit significant fluctuations, typically ranging between $1 billion and $2 billion per day.
At press time, UNI was seeing sharp daily volume, reaching around $4.83 billion. The chain-by-chain breakdown showed that Ethereum is the dominant player in Uniswap transactions, consistently leading throughout the year.
Other networks such as Polygon and Optimism also made significant contributions, but to a lesser extent.
This pattern of volume spikes suggests that Uniswap remained the center of high activity on certain days, perhaps due to the launch of new tokens or trading pairs that attract a temporary increase in trading liquidity.
Ethereum’s continued dominance has indicated its central role, but the growing contributions of other networks suggest a dynamic shift in the decentralized finance (DeFi) trading environment, potentially setting the stage for Uniswap’s price to move closer to the $15 mark.
Could the inverted H&S UNI trigger a rally?
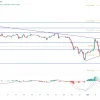
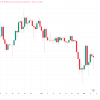
As UNI trading volume reached significant peaks, hinting at increased market activity and the potential for significant price movements, an inverted head and shoulders pattern, a classic bullish indicator in technical analysis, appeared on the UNI chart.
Often seen as a reversal setup after a downtrend, this pattern suggests UNI could set the stage for a significant rally.
The critical point for UNI currently lies at the neckline of this pattern, located around $9.86. A decisive close above this resistance could push UNI towards the $12 to $15 range.
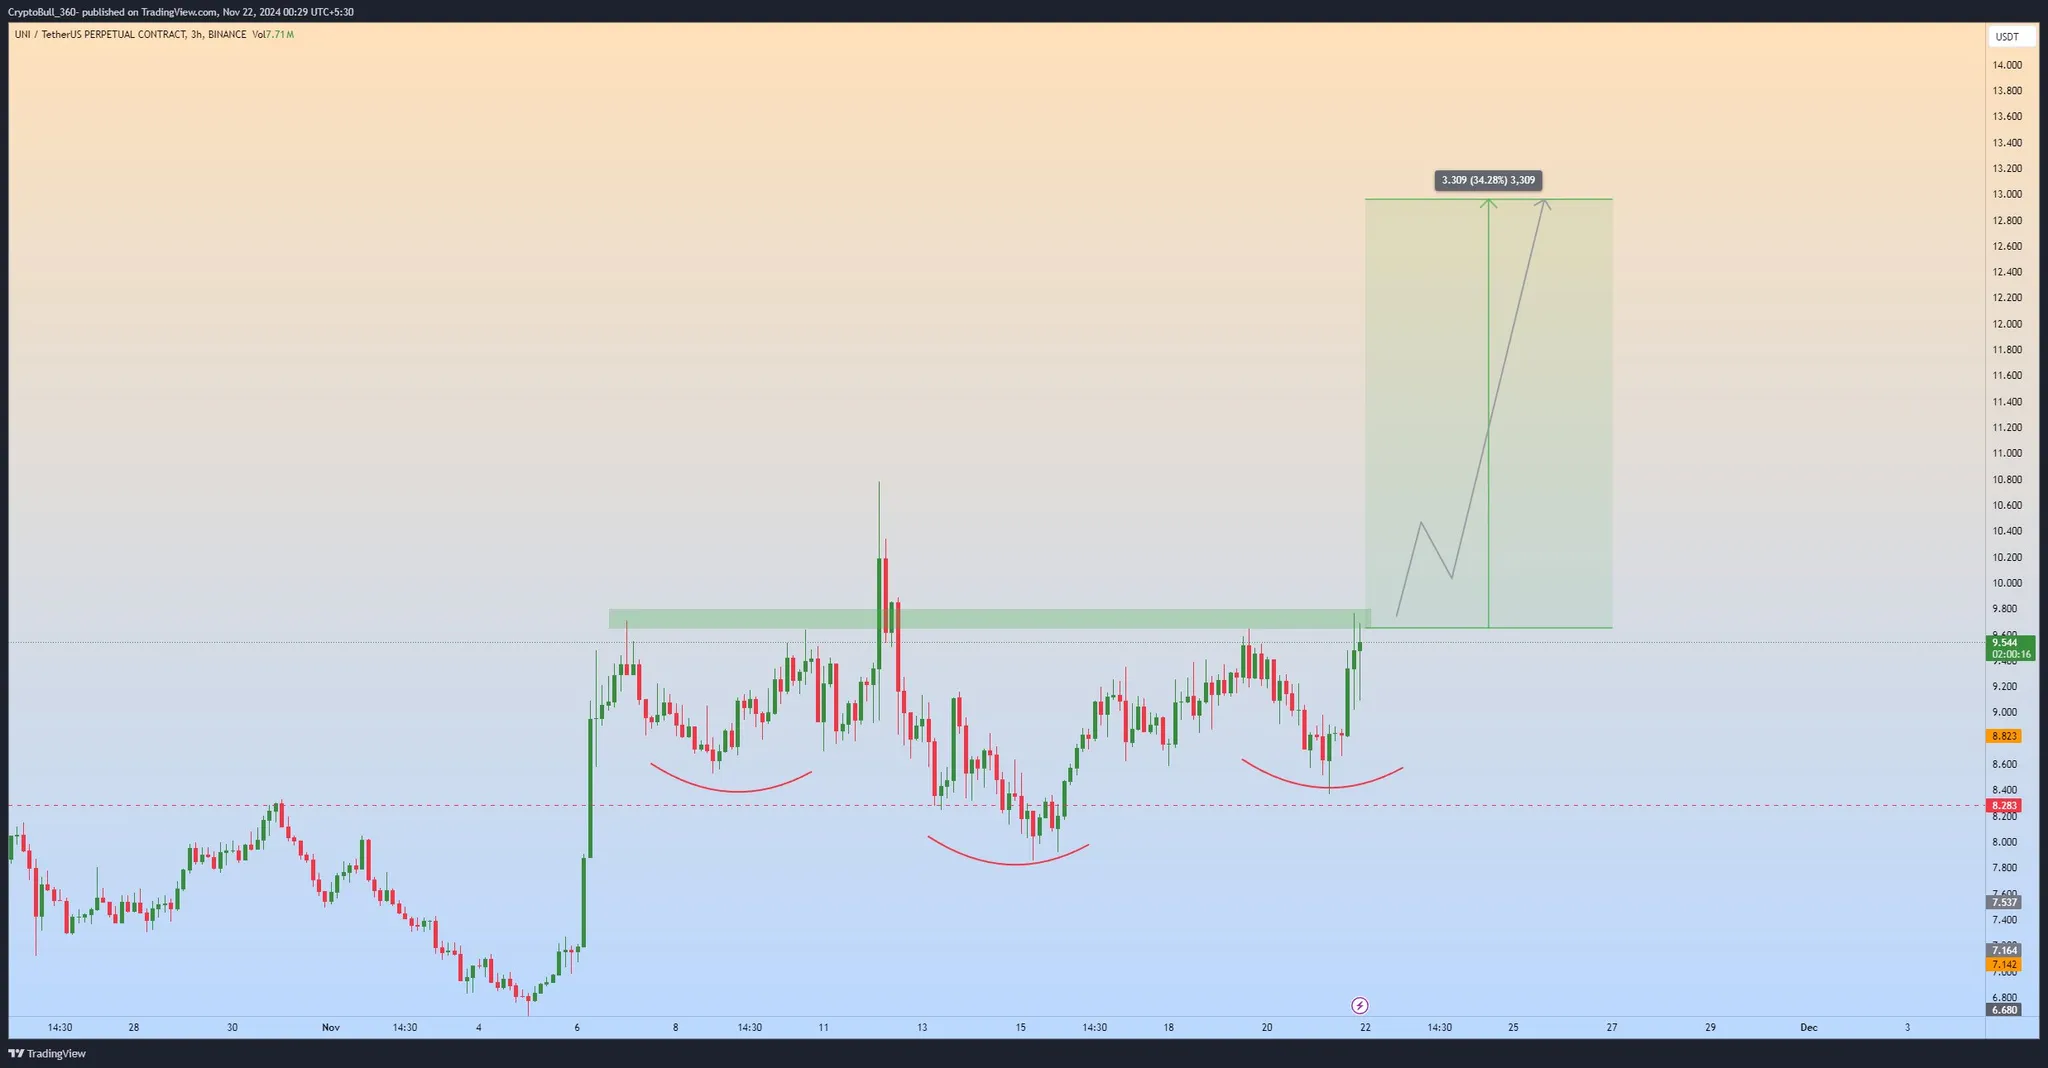
The completion of the pattern coincided with a noticeable increase in volume, which increased the likelihood of an upward breakout. Moreover, psychological resistance at $10.00 could serve as a key marker for traders.
A breakout of this level could further confirm the bullish momentum, drawing more traders and investors into the market, potentially leading to a rapid ascent towards the $15 target.
This chart analysis shows that if the Uniswap price maintains its current trajectory and breaks through key resistance levels, a new price high could well be on the horizon, supported by solid trading volumes and market sentiment.
RSI signals Strong uptrend for Uniswap (UNI) Price
This week’s RSI heat map presents a striking picture, especially for the major cryptocurrencies.
On the left side of the chart, assets such as Bitcoin (BTC), Ethereum (ETH) and Ripple (XRP) are exhibiting overbought RSI values, signaling sustained upward momentum.
In contrast, mid- and small-cap tokens to the right reflect much weaker RSI signals, suggesting less investor enthusiasm or growth potential compared to their larger peers.
The distribution indicates a market trend where investors are heavily leaning towards established cryptocurrencies, perhaps due to their perceived stability and reliability in uncertain economic times.
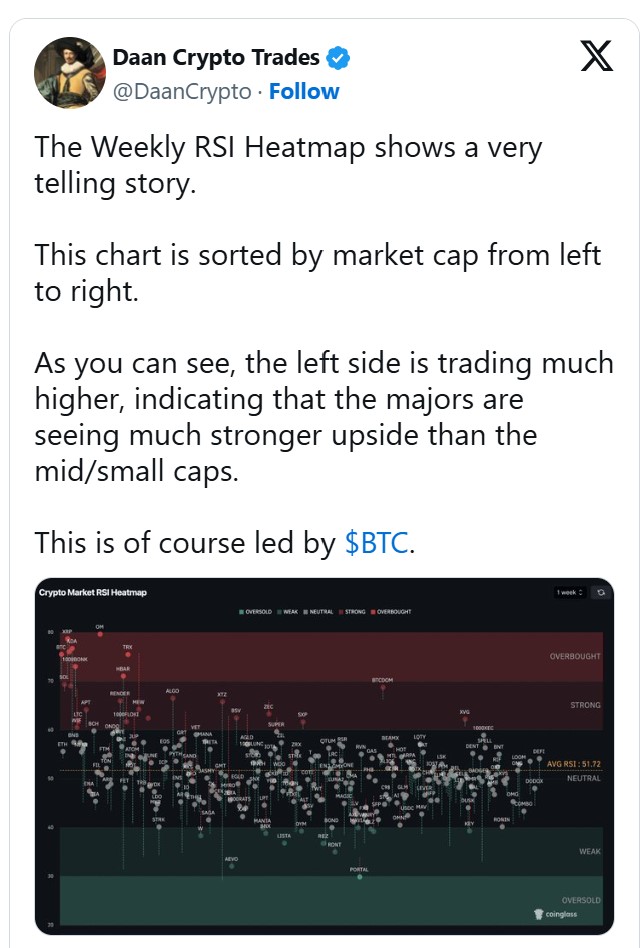
Moreover, this heat map shows marked differences in market sentiment depending on asset size. Strong RSI readings for major cryptocurrencies indicate growing confidence among traders who can forecast further gains if the momentum continues.
This analysis was critical for risk management traders as it suggested that major stocks could offer a safer haven from market volatility, while smaller caps could present higher risk-reward scenarios.
This chart captures a pivotal week in cryptocurrency trading, marking a potential shift in market dynamics in favor of larger, more established cryptocurrencies.
