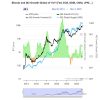
Bitcoin reached a crucial price level and secured a huge win with a $62 billion rise in open interest, paving the way for further gains as it fuels the asset’s future growth.
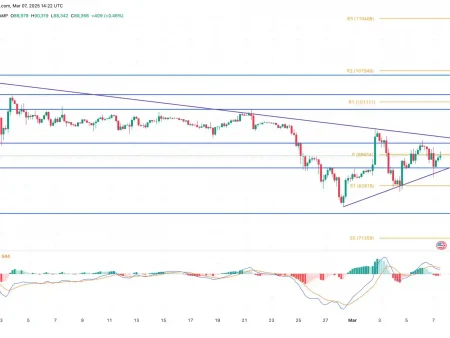
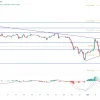
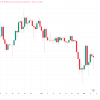
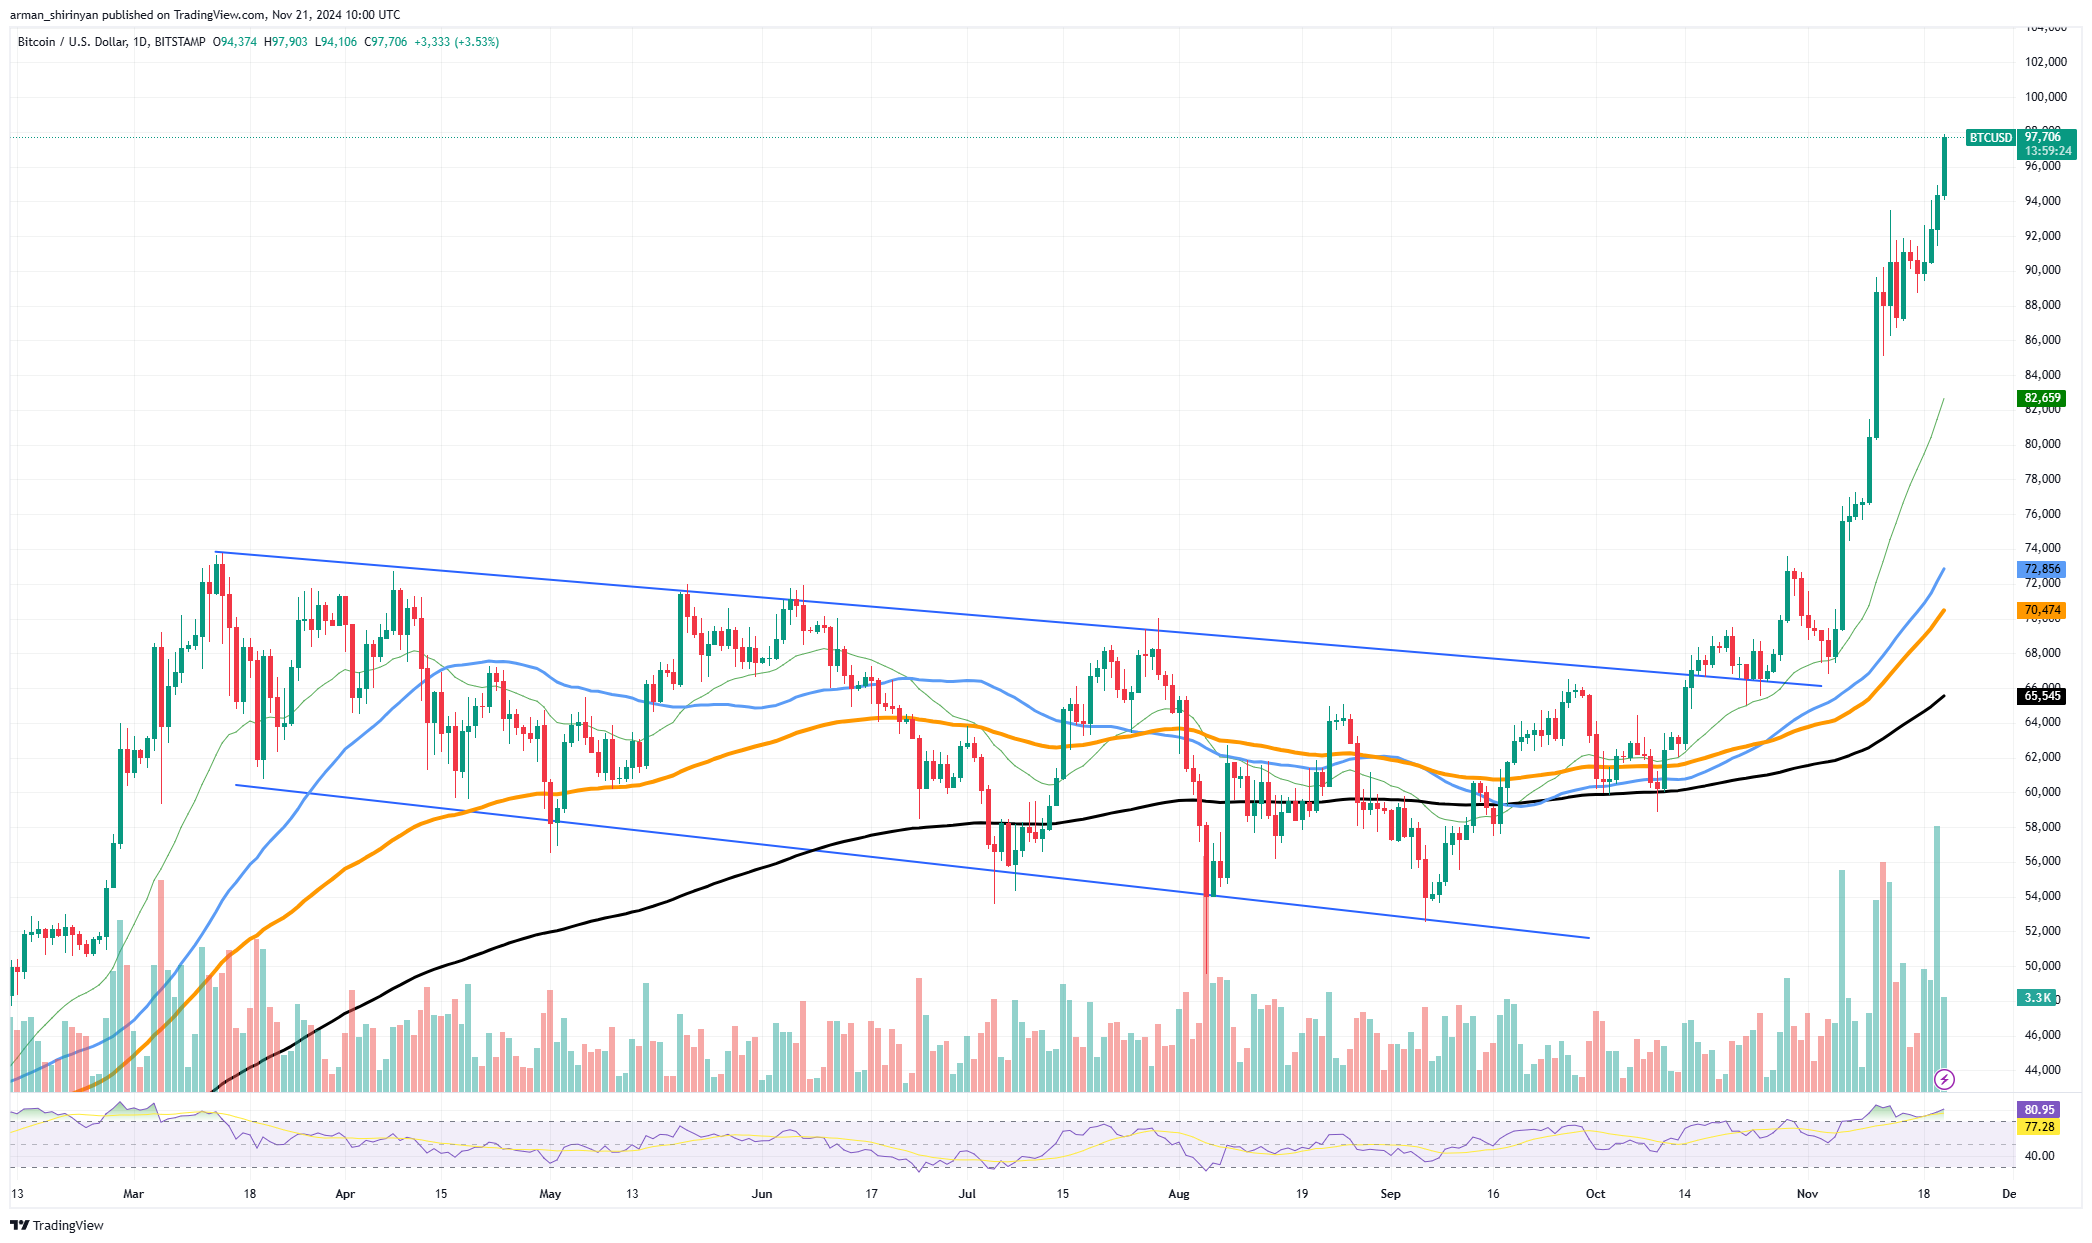
The Bitcoin price chart shows a significant breakout from the downward channel that triggered the move towards $100,000. The 50- and 200-day moving averages also look bullish, leveling off perfectly, indicating a continuation of the positive trend in the market.
However, the open interest chart looks much more optimistic. The record increase in open interest in Bitcoin clearly shows the market’s desire to recover. Significant capital inflows should improve sentiment among traders, and the jump in prices could attract even more retail and institutional investors.
However, capital inflows can sometimes create a spike in risk as a surge in market volatility can trigger liquidation, pushing some investors out of the market and making price swings more extreme. Historically, high open interest has been a signal of an upcoming short-term correction, although the overall trend is bullish.
Given the sharp increase in dynamics, the opportunity to exceed the $100,000 mark is more than real. Key resistance levels have already been broken, and Bitcoin is trading somewhere in the middle, which can also be considered a test for the market. A successful breakout of these levels could easily trigger a parabolic rally and even trigger a strong recovery.
Bitcoin’s macro trend is also supporting the current momentum thanks to the influx of institutional investors, a growing economy and active inflation hedging. Bitcoin adoption is also growing, providing an additional source of fundamental growth.
The path to $100,000 is long and difficult even for the largest asset on the market. Rising open interest confirms that the market is ready for this move, but history shows that psychological milestones quite often become points of pullback and correction, so it is imperative to remain vigilant and anticipate any volatility in the future.
