Solana, the fifth-largest cryptocurrency by market cap, could be on the brink of a price reversal if history repeats itself.
Solana, the fifth-largest cryptocurrency by market cap, could be on the verge of a price reversal if history repeats itself.
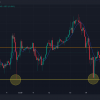
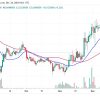
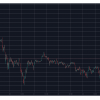
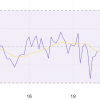
A cryptocurrency and stock analyst and investor who goes by the name “Jelle” on x has drawn attention to a chart pattern that is eerily similar to the one that preceded SOL’s breakout in 2022. The analyst’s remarks come in a period of market uncertainty, which has also affected Solana.
In 2022, this technical setup foreshadowed a significant rise in SOL price, triggering a breakout and, consequently, an uptrend. The pattern resembles a descending triangle pattern, which is typically considered a continuation pattern in a dip; however, when it occurs after a significant downtrend, it can signal a reversal.
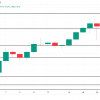
Currently, Solana is showing similar market behavior, and this pattern is about to complete. This is a critical moment, when the price is expected to bottom out and a breakout occurs. If history is any guide, the breakout could move in an upward direction, which could reverse SOL’s recent negative trend.
At the time of writing, SOL was up 1.72% in the last 24 hours to $139.
Will history repeat itself?
While patterns can provide information about possible market movements, it is important to note that they are not infallible predictors. Various factors, including market sentiment, fundamental developments within the Solana ecosystem and broader economic conditions, may influence the outcome.
The market is closely watching the price development of SOL. A break above the upper trend line could confirm the bullish reversal and signal the start of a new uptrend. Conversely, a failure to breakout could indicate continued consolidation or a possible decline.
As patterns do not always repeat perfectly but often rhyme, for now, all eyes are on SOL for potential profits if history repeats itself.

 Tomiwabold Olajide
