In a previous analysis, BeInCrypto published a bullish forecast for Kaspa (KAS) when the price was trading at $0.14.
Subsequently, it reached a new all-time high of $0.194. Now trading between $0.16 and $0.17, this analysis serves as an update to the previous price prediction.
Kaspa Price Analysis: Bullish Outlook
KAS saw a 14% decline following Bitcoin’s price correction from $70,000 to $66,000. This moderate decline saw KAS fall from $0.194 to $0.150 before settling between $0.160 and $0.170.
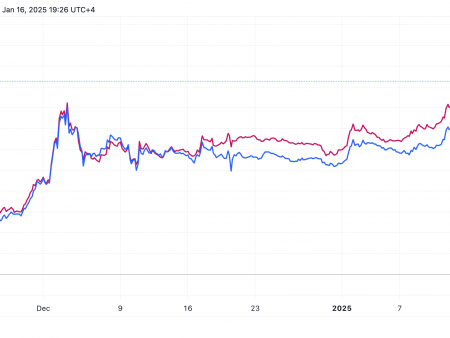
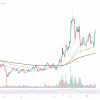
The price has fallen below the key support level of $0.171, which is now a critical resistance level to monitor closely. KAS tested the basic support (in red) at $0.151 and $0.155, reinforcing this line as a strong support level.
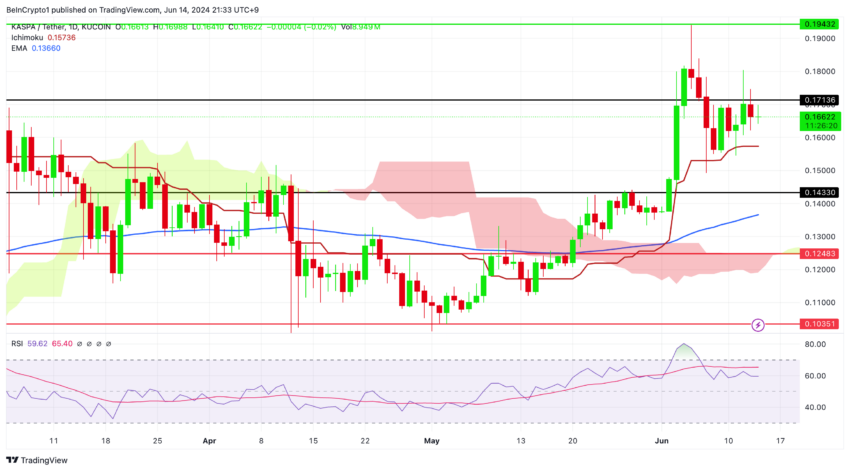
Kaspa price analysis. Source: TradingView
Despite the recent decline, the price outlook for KAS is not bearish. The price remains above the daily Ichimoku Cloud red baseline.
Read more: How to buy KASPA and everything you need to know
Ichimoku Cloud is a technical analysis tool that shows support and resistance levels, trend direction and momentum. It is made up of multiple lines. The baseline represents the midpoint of the 26-day high and low prices. It is used to determine the direction of the trend and potential support or resistance levels. All support levels in the analysis are determined by the baseline.
The daily RSI (in purple) is around 60, indicating the potential for a price decline if it starts trending towards 50 or 40, underscoring a bearish trend.
An RSI below the 14-day average, shown in pink, could indicate potential price appreciation. This could happen if KAS breaks above the $0.171 resistance level, potentially reaching new all-time highs.
HODLing for short-term holders: $0.20 target in reach
This indicator segments Kaspa’s total circulating supply by holding time, tracking both short- and long-term holder behavior.
Analyzing the percentage of supply that has remained inactive for more than 3 months is critical to understanding holding patterns and market sentiment among different groups of holders.
The metric of idle supply for more than three months serves as a barometer for market sentiment of short-term bond holders versus idle supply (%) held for more than one to two years.
A decline in this metric could signal an increase in risk, while an increase indicates growing demand from new investors.
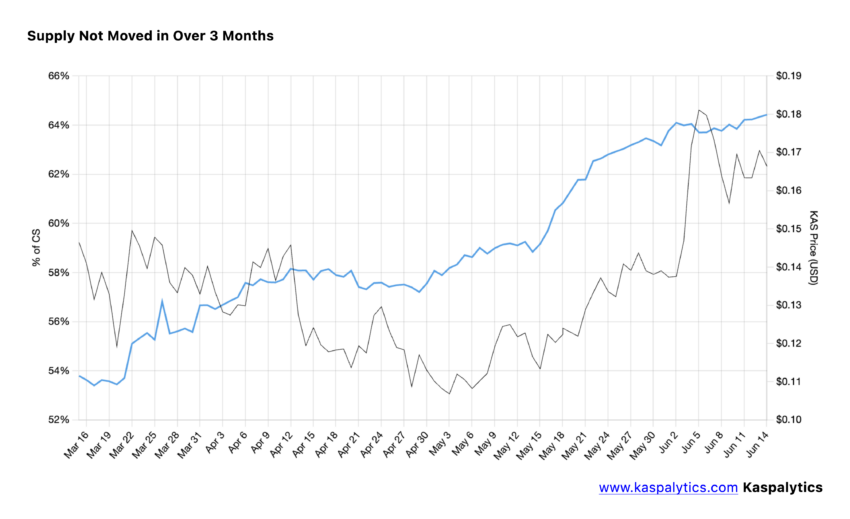
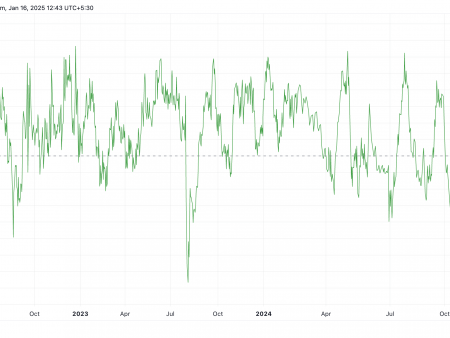
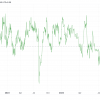
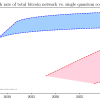
Idle supply (%) for more than 3 months. Source: Kaspalytics
From May to today, KAS Supply, which has been inactive for more than three months, has increased from 57.18% to 64.43% of the total circulating supply, signifying strong holding behavior by short-term holders.
This strengthens our bullish outlook for Kaspa. We expect the price to break above the all-time high and reach the $0.20 – $0.30 range.
Analysis of supply that has not been spent for more than one year and more than two years can provide a deeper understanding of the behavior of long-term Kaspa holders, especially in the context of recent price drops.
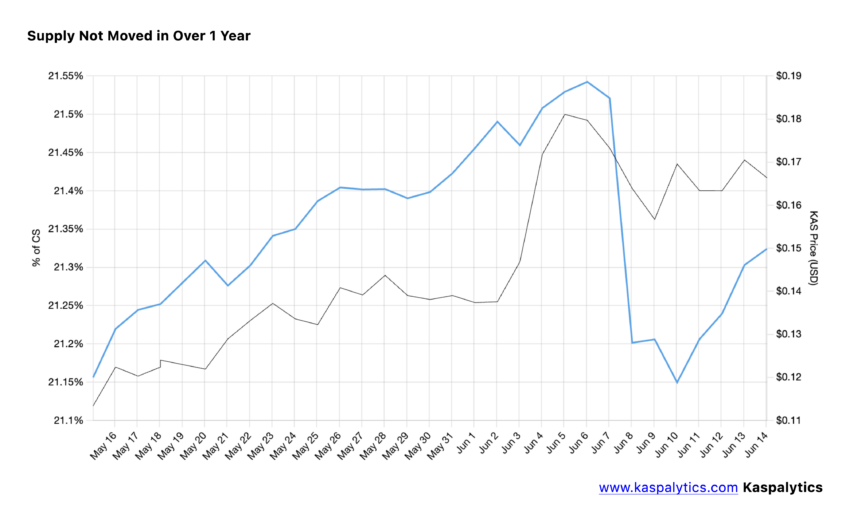
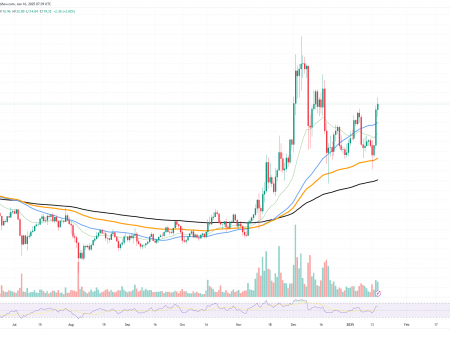
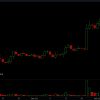
Idle supply (%) for more than 1 year. Source: Kaspalytics
Slightly decreasing, from 21.5% to 21.2% of the total in circulation. This slight decline suggests that some medium-term bond holders are engaging in profit-taking or risk management, but the overall holding pattern remains relatively stable.
KAS Price Prediction: $0.20 or $0.14 Next?
In addition to this, a similar slight decline was observed in the amount of Kaspa that had not been moved for more than two years, indicating profit-taking and risk-mitigation strategies by holders. Specifically, supply held over two years decreased from 5% to 4.8% of total circulating supply, reflecting some level of selling activity among long-term holders.
Read more: Where to buy Kaspa (KAS): 3 best platforms for 2024
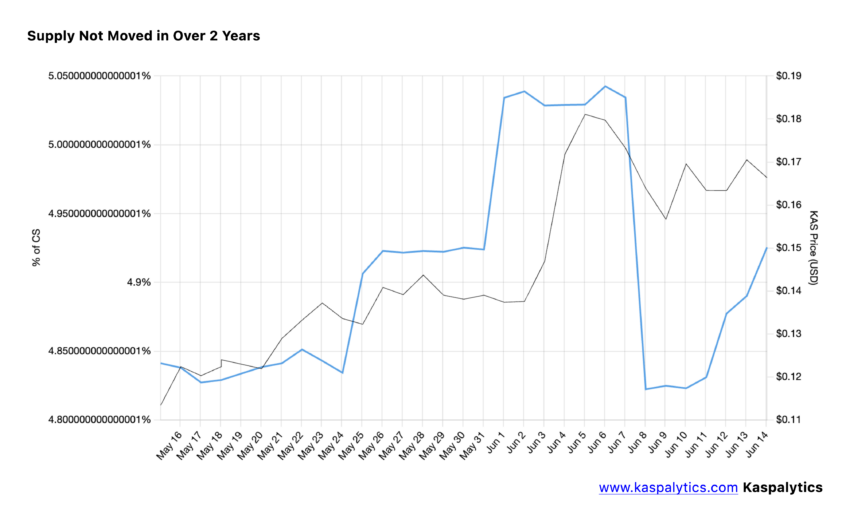
Idle supply (%) for more than 2 years. Source: Kaspalytics
The price of KAS has declined following the overall correction in the cryptocurrency market since June 7. However, it remains resilient above the key support level, which is the Ichimoku baseline.
If it sustains a break below this line, it could potentially reverse the trend from bullish to bearish. In that case, the key support levels would be $0.143, $0.124.